Authors: Chelsea Conlon and Alexandra Rozen, Engineers with JKMuir
As water, wastewater, and industrial facilities continue to search for cost savings opportunities, energy bills frequently become a focus of attention along with pursuing energy efficient equipment and systems. Energy conservation can significantly reduce plant electrical costs; however, electric utility billing structures continue to evolve and are now directed more heavily towards electric demand versus electric usage.
Through the evaluation of over 150 water and wastewater treatment facilities and pumping stations, JKMuir has found that one of the most effective ways to reduce energy costs is to manage and control demand. Demand charge is a significant and often misunderstood portion of many industrial facility electric bills. Simultaneous operation of equipment, peak flow conditions, pump cycling and sequencing, and oversized equipment can all contribute to higher than necessary electrical demand. In this article below, we review the methodology used by various New England electric utilities to determine demand charge, as well as the associated fees. We also review specific examples of how facilities can reduce their demand charge and overall electric costs, including an overview of the demand cost savings opportunities at several New England plants.
JKMuir conducts energy audits at water, wastewater, and industrial facilities throughout the country. As part of this process, we analyze the efficiencies of equipment and systems and then identify ways to improve efficiencies to decrease the energy usage and costs. In addition to improving efficiency and reducing the amount of energy used, another way to reduce energy costs is to become familiar with the electric bills and how the facility is billed for electricity.
Each facility’s electric bill includes supplier charges and delivery charges. Supplier charges are associated with the generation of electricity, while delivery charges are associated with the infrastructure needed to get the electricity from the generation site to the customers (poles, wires, transformers, etc.). There are energy usage charges where energy is measured in the form of kilowatt hours (kWh) and energy demand charges where energy is measured in the form of kilowatts (kW) or kilo-volt-amperes (kVA).
So what strategies can we employ to reduce electric demand charges? Electric demand is the instantaneous power draw measured in kilowatts (kW). Electric demand is different than energy usage, which is the energy used over a period of time and is measured in kWh. If you look at the New England electric system demand plotted over one day, you would see a graph with a shape similar to that of a diurnal wastewater curve (see figure 1 below). There is a peak in the system demand in the morning hours and another peak in the evening hours when many people are using energy.
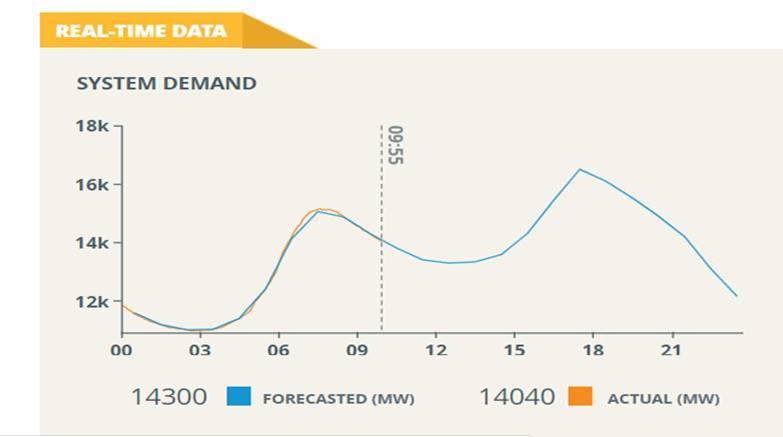
Figure 1 – Image source: ISO New England Real Time Data on January 4th, 2019 at 9:55 AM
ISO New England is one of the entities around the country that analyzes and tracks the local power market. On their website they have a map of New England with the current electric system demand and the cost of electricity in the day ahead market that updates every 5-minutes. The cost of electricity is determined by many factors, including demand. As the electric system demand increases, the cost of electricity also increases. There are a few reasons for this. First, the utilities’ equipment is sized based upon the highest electric demand peak they would expect to see. The electric utilities must ensure their equipment can withstand the high peak conditions. In addition, as more energy is required to meet system conditions, older / ‘dirtier’ / more expensive power plants must come online to meet customer’s needs.
If we look at two snapshots of 5-minute time periods when the system demands were different (see figure 2 below), we can see the effect that system demand can have on the cost of electricity. On January 4th, 2019 at 10:10Am the New England electric system demand was 13,985 megawatts (MW) and the cost of electricity in the day ahead market was $20.16 per MW or $0.02 per kW. If we compare this to December 29th, 2017 at 10:50 AM when the system demand was 18,658 MW, the cost of electricity was $258.03 per MW or $0.26 per kWh. System demand can have a large effect on the cost of electricity, along with other factors impacting the availability and source of power to the local grid.
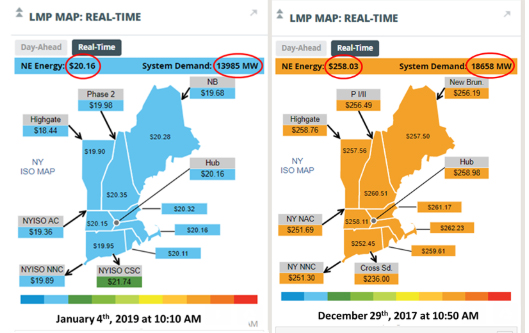
Figure 2 – Source: ISO New England Real Time Maps and Charts on January 4th, 2019 at 10:10 AM and December 29th, 2017 at 10:50 AM.
Electric bills can have a large number of line items; however, if you break those line items down into energy usage charges and demand charges, it can make it more manageable to interpret. Once you separate out the demand charges, you will see there are multiple line items and different kinds of demand charges. For example, A pump station in Connecticut can have a transmission demand charge of approximately $7 per kW and a distribution demand charge of $13 per kW, under current rate structures. Overall this pump station is charged approximately $20 per kW for demand. This is typical for pump stations, especially in New England and other high power cost areas of the country. In this example, Electric demand charges account for about 35% of this pump station’s overall electric bill. Typically, demand charges can account for 20% to 40% of the overall energy costs at industrial facilities.
A facility’s rate structure determines how they are billed for electricity and what demand charges show up on their bill. The rate structure a facility falls under is based on the utility, location, and size of the facility. There are many different kinds of demand charges that are outlined in different rate structures. A few important types of demand charges include time-of-day charges, kVA charges, and ratchet charges. It is important for facilities to know what rate structure they are billed under and what types of charges are included in their rate structure. Understanding your rate structure can open doors for energy cost savings at your facility.
A popular method of energy usage and demand billing are on and off-peak charges. On-peak charges fall during the day-time hours, while off-peak charges occur overnight and during weekends. Specific start and stop times vary based on the rate structure. Typically, facilities are charged at higher rates during on-peak hours; there is typically lower or no charge for off-peak demand.
Facilities are also billed based on the highest average 15-minute or 30-minute peak demand. High influxes of electricity (when a large number of equipment turns on simultaneously, for example) do not affect demand charges because demand is based on the 15 or 30 minute rolling average demand.
So how can we work with these demand charges? Every facility has unique equipment that operates in a unique way. Imagine if at your facility you have one 100 HP blower that operates all the time and another 100 HP blower that occasionally turns on and operates for short spans of time. If you are able to prevent the second blower from turning on during peak hours, you could reduce your peak demand by up to 75 kW. Under a typical New England rate structure where demand costs could be $12 per kW, you could save over $11,000 annually in demand charges.
Let’s consider a different operating scenario – maybe instead you have several differently sized influent pumps. A 100 HP pump operates continuously, and a 200 HP pump operates during high flow conditions. You also have 50 HP in miscellaneous solids handling equipment that operates for one shift per day. If you are able to delay the solids handling equipment to operate when the 200 HP pump is not in operation, and you are under a rate structure with demand charges at $15 per kW, you could save over $6,500 annually at your facility. To reiterate, these examples show the types of operating changes that can be made and the magnitude of savings they could return. The unique equipment and operation of each plant should be considered when determining ways to reduce demand.
In a case study of a water treatment plant evaluated by JKMuir, a 100 HP backwash pump operated once per day in the summer and once every other day in the winter based on filter differential pressure. By altering the operation of the filters to ensure operation during off peak hours, the facility could reduce their peak demand by 64 kW at $5.76 per kW for a total of over $4,400 in annual savings.
Another important type of demand billing is kVA billing. Certain rate structures charge for demand based on the higher of the peak demand measured in kilowatts or the 90% of the peak demand based on kilovolt-amperes. This charge is affected by the power factor at your facility, which is defined as kW (real power) divided by kVA (apparent power). It is a measure of the efficiencies and losses in the system. Often the targeted power factor by electric utilities is 0.9. If your facilities power factor is below 0.9, there are a few steps you can take to increase this power factor, reduce demand and associated charges. A large capacitor can be installed to correct the power factor of the entire facility, or smaller capacitors and VFDs can be added to individual equipment identified as having low power factor. Equipment to look out for are mixers, aerators, and oversized pumps that are not on VFDs, or equipment with lightly loaded motors.
Consider a facility with a peak kW demand of 2121 kW and a peak kVA demand of 2772 kVA. The facility is charged based on 90% of the kVA (2494.8 kVA) because the facility’s power factor is 0.77. By adding capacitors or VFDs to equipment, the facility should be able to correct its power factor to 0.9. Doing this will reduce the kVA so that 90% is equal to the kW value of 2121. This will result in savings at the facility of over $25,000 annually.
Ratchet demand charge can be another extremely impactful charge on your electric bill. Typically, large facility rate structures include a ratchet charge. The ratchet causes facilities to be charged based on the peak demand in the current month or the preceding 11 months. This makes lowering your peak demand even more important, because a high peak demand for a short amount of time can wind up costing you a great deal in demand charges over the next year. An example of how the ratchet charge works is shown in figure 3 below.
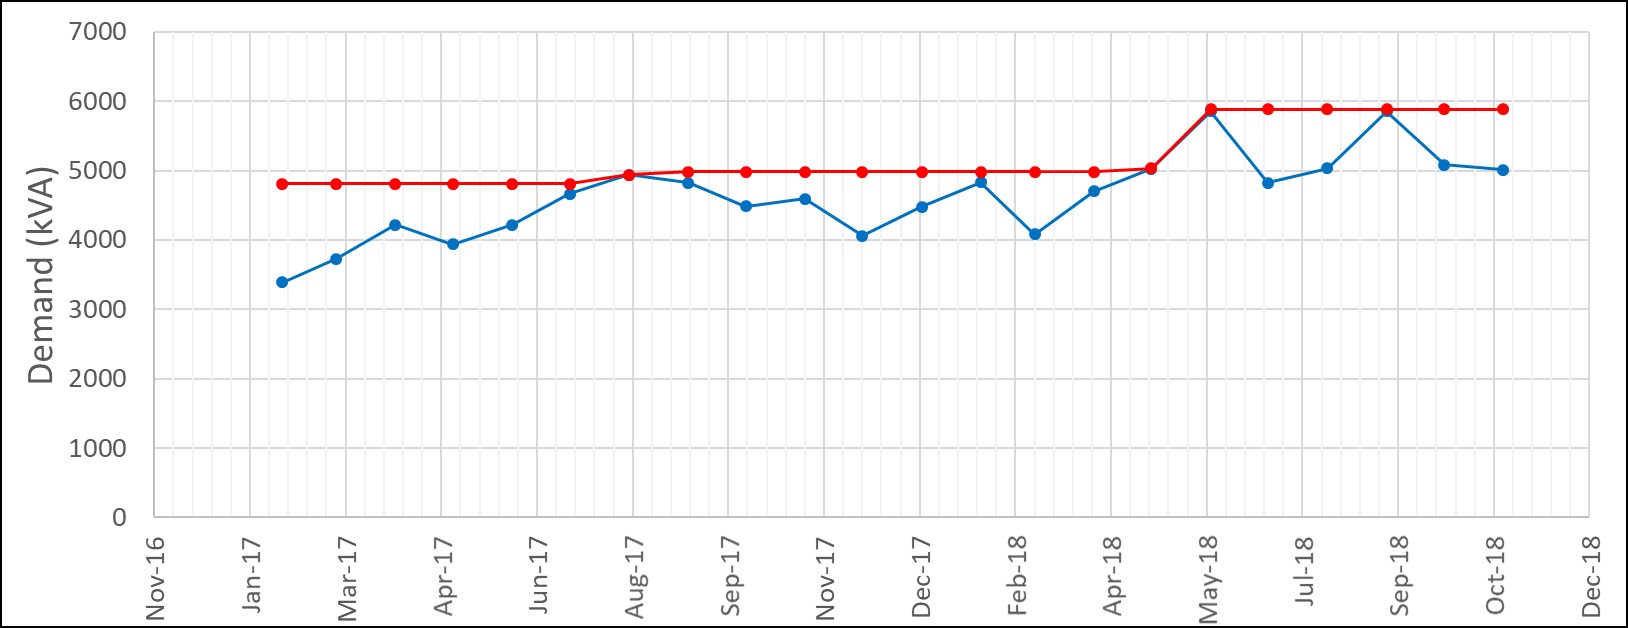
Figure 3.
Monitoring demand at your facility is a way to be proactive instead of reactive. It can be difficult to pinpoint why your facility had a higher demand one month when trying to review historical data at the time the bill comes in the mail. It is difficult to remember what happened during the last month and what could have caused that peak. Having a demand monitor allows you to pinpoint what causes demand peaks at your facility and allows you to have the opportunity to prevent those peaks from occurring in the first place. With a demand monitor you can set up alerts in SCADA or another system where facility personnel are notified when demand is reaching a peak. This gives them the opportunity to shut down and delay the operation of any non-essential equipment, which would level out the demand at your facility and avoid a peak. In addition, having a demand monitor allows you to cross check your utilities electric demand meter.
Demand response programs can be a potential revenue stream. The programs differ in each state and utility, but they typically entail energy users signing up to commit to reducing energy use during peak demand events. The users are agreeing to curtail their load or switch to on-site generation to reduce the amount of electricity they are drawing from the grid during specific high grid demand periods. Demand response programs help balance system demand and stabilize the electric grid. Program participants are paid an incentive based upon the amount of reduced demand.
Some first steps your facility can take to get a better handle on demand charges include the following:
- Review your rate structure. Look at your electric bill to find out what rate structure your facility is billed based on. Go on your utilities website to find a description of the rate structure and demand determination. If you have trouble finding it or have any questions reach out to your utility’s representative.
- Review your electric bills. Find out if your facility has a point person that reviews the electric bills when they come in each month. It is important to have someone double checking the charges to make sure they make sense and to see how they change from month to month.
- Get creative with equipment operation. Brainstorm small operation changes you can make to decrease demand at your facility.
- Determine if demand response is an option. See if your facility qualifies for local demand response programs and what you need to do to apply.
Contact the Engineers at JKMuir for more information on how to reduce your electric costs at your facility.