Author: Ernesto Primera
This article is intended to show the importance of watching over the health of a pump from different perspectives; by “health” meaning the range between the ability and inability to accomplish its primary and secondary functions within a specific context and work environment, with previously established limits, and with a previously defined mission.
Through this manner of watching over the health of a pump, called “Full-Scale Diagnostics,” all key aspects that allow to determine a condition between Optimum and Unacceptable working order, will be considered in order to raise the levels of certainty for adequate decision making regarding managing the useful life of the asset, while focused on its productivity.
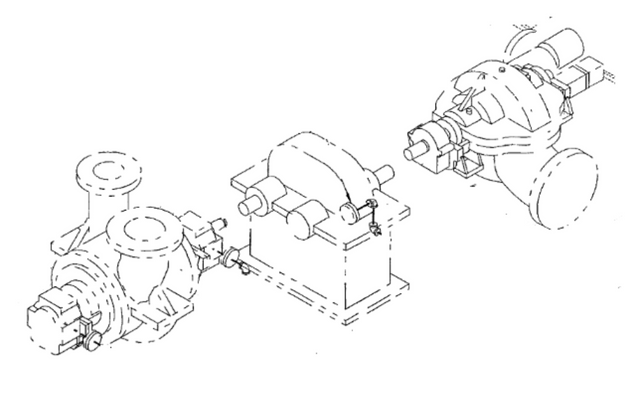
First, we must understand when regarding a Pump, that we must also regard the full Train, which elements play a specific role, and the Train may be comprised of different types of conductors (Electric Motors, Combustion Engines, Steam Turbines, Gas Turbines) and power or speed transmissions or regulators (Gear Boxes, Hydraulic Coupling), including the auxiliary and support systems such as sealing, lubrication, and protection systems.
The Mechanical Condition
The Manufacturing industry (Beverages, Pulp and Paper, Cementing, among others), of Oil, Gas, Petrochemical, Power Generation and Mining, has evolved in the last 20 years regarding the evaluation of its pumping systems, resulting in robust condition-monitoring systems today. As an example of that, I will refer to my own experiences. In the early year 2000, I recall conducting my vibration and temperature data collection routes inside the facilities of an oil field for the production of 240 MBPD extra heavy crude oil. The information was received from Oil Pumping trains comprised of Electrical Motors directly coupled to (horizontal double screw) positive displacement pumps. In those years I used a 2-channel portable vibration data collector/analyzer and a laser pyrometer to measure the temperature. All data was stored in the portable equipment while I was doing the field work. Other data was entered manually through the alphanumeric keyboard of the device. This we used to call, and still call: “Condition Monitoring”.
Then there was a second stage, where I would go to my office, and at my work station I would download all that information into a software in my computer, first to see the proximity of the value resulting from the field inspection with the preset alarm levels set by standards and good practice references. This would determine the “Severity” of the condition; and secondly, I would be able to observe the trends of each of those variables in terms of time, as such variability could be used to predict the machine’s future behavior in terms of that particular variable (Typically Vibration and Temperature). We used to call this process “Predictive Maintenance”. Back then, the software would already allow us to make lineal extrapolations of the historic steps, meaning: 17 years ago, we were already making condition “Prognostics”.
It should be mentioned that all the machines monitored with portable instruments were those with a medium criticality level, as the critical machinery was equipped with instruments, cables, junction boxes, PLC among other fittings, which would allow us to check the values measured in the field almost in real time in our PCs at our work stations.
Today, we have evolved in the way we collect data, as we use wireless devices and the information travels to our smart phones. We monitor in real time. We store the information on virtual clouds and it can be analyzed at any place in our globe.
Going back to my own experiences, I remember working in an oil processing plant with Distillation and Hydrocracking processes – among others – of more than 200 MBPD of production, where we had implemented what we called the “Integral Predictive Maintenance”. It was the combination of several predictive techniques, applied to a single train of machineries:
– Vibration Analysis
– Infrared Thermography
– Analysis of Lubricating Oils and Tribology
– Ultrasonic Noise
I used to conduct these integral maintenance inspections more than 15 years ago.
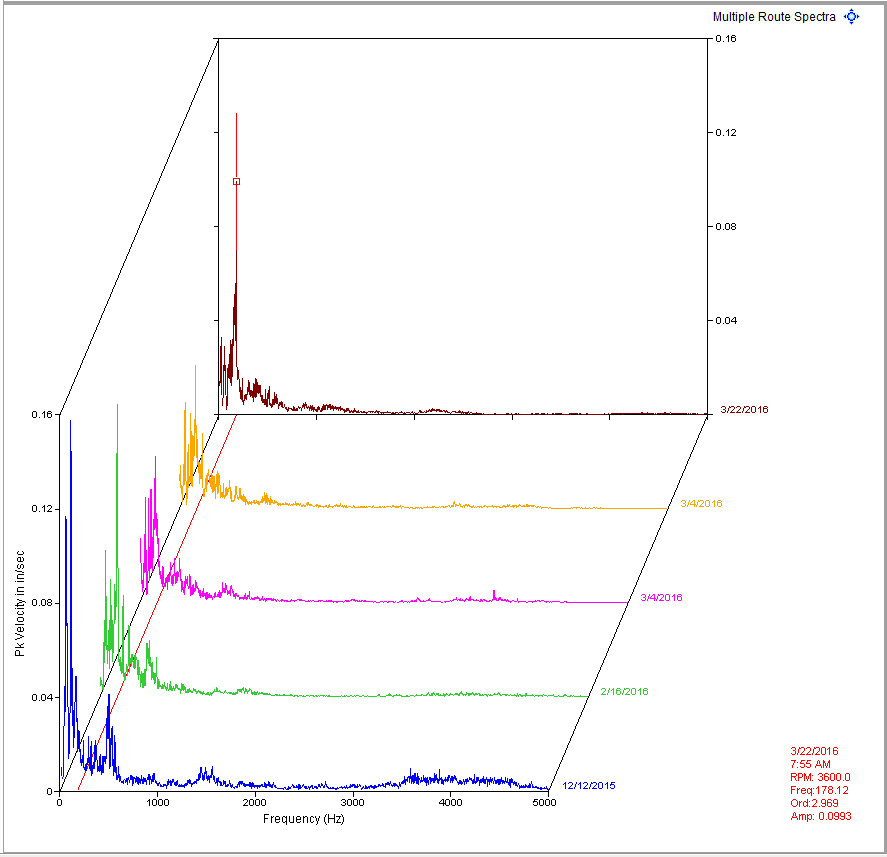
Figure 2: Sample of Vibration Chart
Performance and Efficiency
Depending on the type of machinery that makes up the Pumping System Train, there are other branches of science that play a very important role during the evaluation and diagnostics within their productive cycle, such as Hydraulics, Pneumatics, and Thermodynamics.
If we consider a centrifugal pump, its capacity to play its main role, which is to deliver a certain amount of non-compressible fluid in volume units within a specific time, will depend on its hydraulic performance and efficiency, as these will be capable of altering the system where it operates, and even the performance of its conductor equipment. The Pumping systems are selected to work in a hydraulic point known as BEP “Best Efficiency Point” with known margins such as a preferred and acceptable operational window, in addition to specific values of power consumed for each of the operation points inside and outside the operational window, expressed in absorbed power units.
Additionally, the conductors such as electric motors are selected for the same points of operation. These are selected after the pump and their power margins are lined up with these operational windows. That is why we may have cases of inefficient pumps, which high power consumption for carrying out the required work may cause an unforeseen shutdown activated by the motor’s protection system at high winding temperatures.
The analysis of these variables means a performance and efficiency analysis capable of determining the date when a next major overhaul may be needed or when an intervention may be conducted prior to an unexpected shutdown based on the deviation from efficiency in time in terms of its base line. We are talking about a very important decision for planning and investment. Through these analyses, we are conducting the Diagnostics and Prognostics.
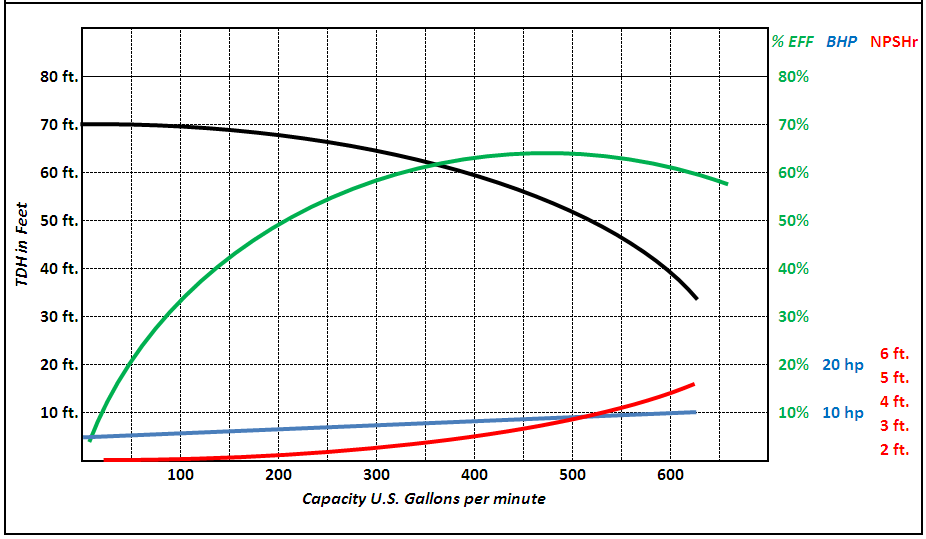
Figure 3: Sample of Pump Performance Chart
Reliability
All the equipment I have commented on in the previous sections, to which we monitor for status and performance and efficiency, in many cases have been in operation for more than 50 years; such is the case of the 2000 plus pumps and the more than 90 compressors with which I currently have the pleasure of interacting at Petrochemical Refineries on the coast of the U.S. gulf. Each of them is currently managed in a computerized maintenance management system (CMMS) and even in asset management systems (EAM) and for over 30 years, the people involved in the maintenance and operation of these equipment have been recording each of the activities associated to each equipment from the pumping train in the above systems. Each has a distinguishing number, Tag, Technical Location, etc. These activities have been classified as Failures or Repairs. For the case of the failures, there are sub-classifications that cover the Damage and Deterioration of the broken component, also known as maintainable item. These failures accumulated in time, represent the reliability of the machine, for which we also have information systems for reliability calculations through the use of the times for failure of each of the machine components (the ones that have failed), but not only do we enter them in the software to get, through a test, an indication of the probability distribution that best fits the data for the analysis, or tell the software to calculate the parameters of the equation per methods of minimum squares or maximum likelihood, NO, we also review the active failure mechanism and compare it to the studies of similar equipment in the same industry, which have determined parameters for probability distributions on the basis of the damage mechanism, like the ones we find in the books written by Heinz Bloch and the many articles by Paul Barringer. It is at this stage where we are looking for accurateness through comparing and verifying the results of the software, and furthermore, the person that studies the machine, knows it or works together with the expert who knows the machine, as the results from an estimate of when the next failure in a component might occur, generated by the same damage mechanism, must be logical and coherent to the eye of the equipment expert. If this complete analysis that we call “Reliability Analysis” is successful, we might be adjusting inspection and maintenance frequencies; we might be getting procurements in advance and checking stocks, all of this thanks to the possibility of making “Failure Prognostics”. Of course, the prognostics does not cover all this, we also have many tools for when the data scenarios are not as robust, and there we could explain how to use availability databases and simulation models and mathematical prognostics like the Monte Carlo model, other models like Markov Chain and Bayes Theorem.
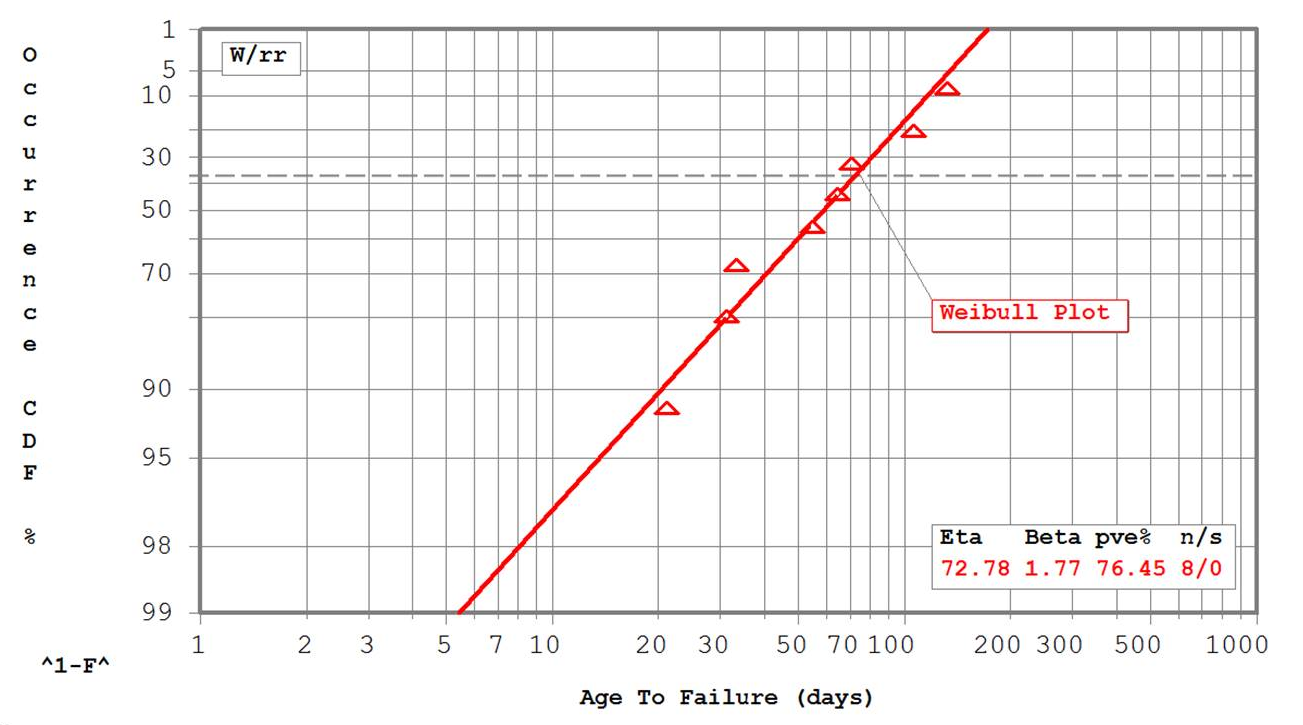
Figure 4: Sample of a Reliability Chart
SuperSMITH® software
Full Scale
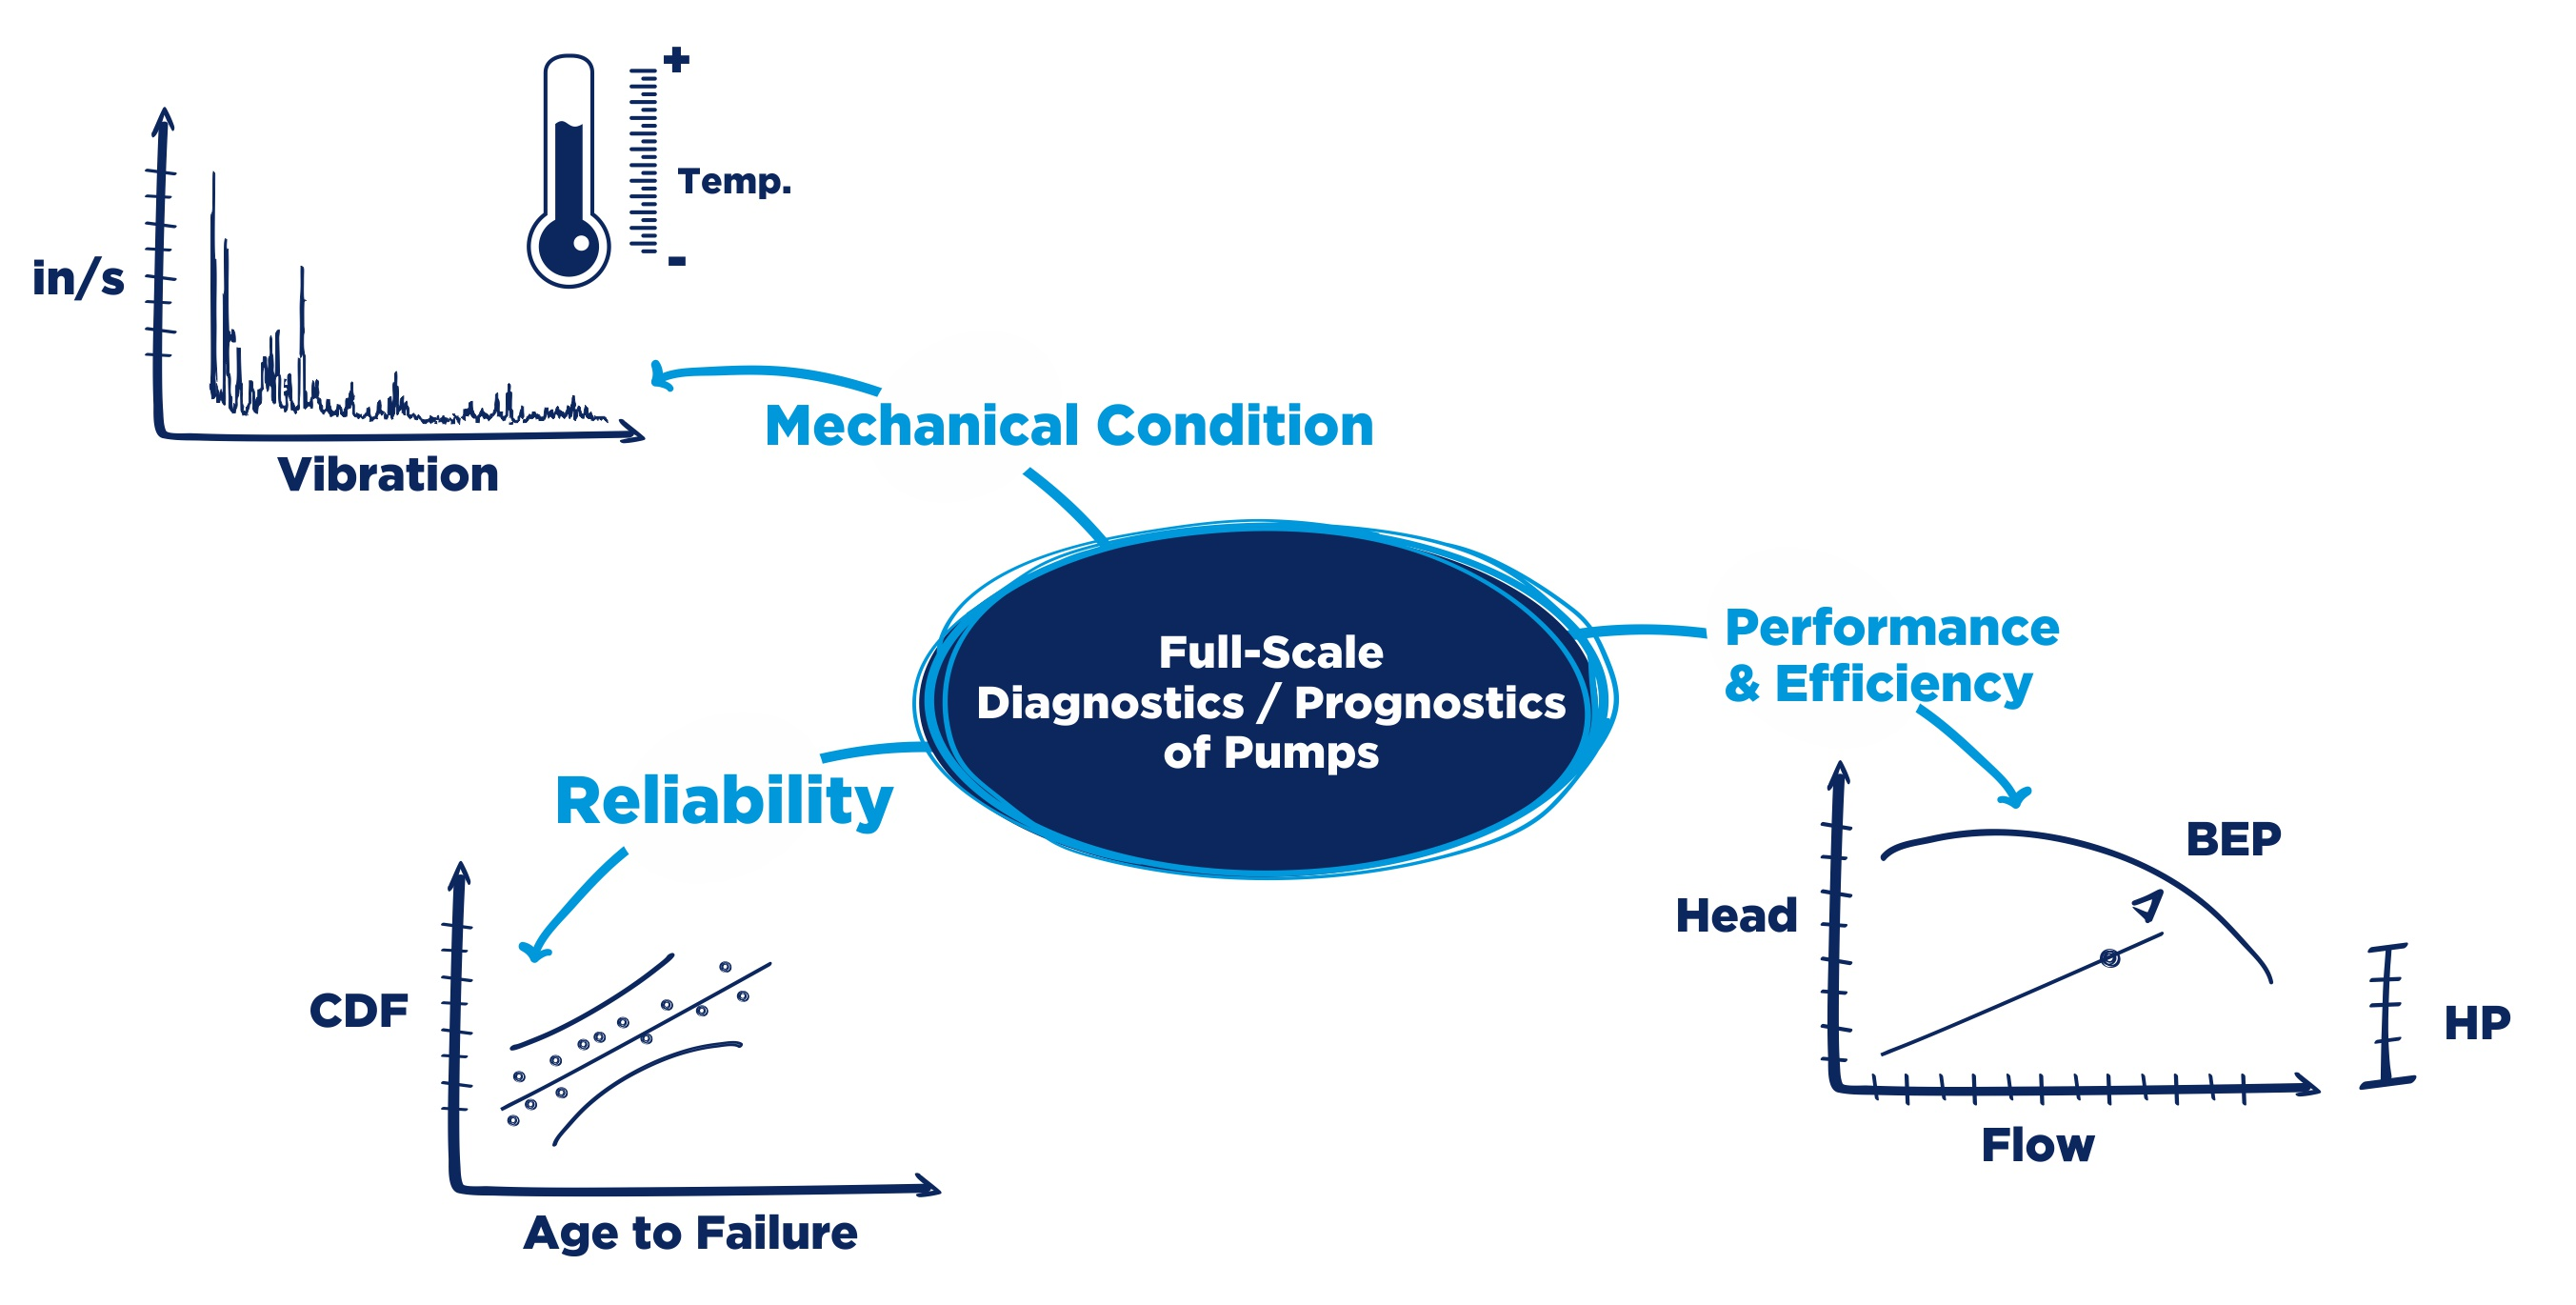
Figure 5: Full Scale Diagnostics-Prognostics Model
Conclusions
Despite the great progress in technology regarding Condition Monitoring, Predictive Maintenance, Diagnostics and Prognostics, that is still not sufficient to know the health status of the machine and make decisions with great certainty, as we have focused on a group of specific variables without deeply exploring the totality of them as well as other elements that intervene and modify the condition of the machine, and how they interact with each other.
It is not proper to want to assure the condition of a pumping system without knowing its hydraulic performance, its reliability, and its integral condition.
But time moves on and with it science. That is why work is already underway on what is known as “Cognitive Diagnostics”. I hope to be able to present Part-2 of this article very soon; a practical example of application of Diagnostics at Full-Scale using Cognitive Models. We are currently only describing the conceptual framework.
6 References and Bibliographical Sources
[1] Bloch, Heinz P. “Petrochemical Machinery Insights”, 1st Edition, B-H, (2016).
[2] Barringer, Paul. “SuperSMITH Weibull Probability Plotting Software”, Barringer & Associates, Inc. (2016).
[3] Sullivan, Mark. “P•SMART Pump System Modeling Software”, Hydraulic Institute, Inc. (2015).