The first human walked on the moon in 1969 when Apollo 11 lunar module landed on the moon surface using hydrogen as rocket fuel for propulsion. It made the U.S the leader in hydrogen production and fuel cells technologies. Due to environmental concerns from burning fossil fuels, the current energy transition in the market to clean energy sources and carriers is getting more important. Hydrogen is one piece of the Net Zero by 2050 puzzle. As an energy carrier which can deliver energy produced from other sources such as fossil fuels, water, and biological processes, it will be essential moving forward.
By Naomi Jabbari, P.E – S&B Engineers and Constructors
Low Emission Fuel: Hydrogen
With a goal to reach Net Zero emission by 2050 and to decarbonize the future by limiting global warming to below 1.5°, hydrogen and low carbon fuels will have long-term application in many sectors; this will be greatly dependent on the cost of hydrogen production, transportation, and utilization. If the U.S energy market can reach the ambitious goal of an ‘Hydrogen Shot’, where USD $1 per 1 kilogram of clean hydrogen is produced in 1 decade (“1 1 1”), hydrogen will likely be used for all sectors. The use of it in such a wide range of industrial sectors would create very high demand in the U.S. and global market.
Hydrogen in Net Zero by 2050 Scenario
In recent years, the energy sector has been responsible for approximately three-quarters of global greenhouse gas (GHG) emissions. The International Energy Agency’s (IEA) roadmap to reach net zero emissions (NZE) by 2050 considers hydrogen and hydrogen-based fuels as key pillars for global decarbonization. Per Figure 1, The U. S.’s long-term strategy to reach net zero no later than 2050 also counts on hydrogen to meet additional goals by 2030. The Nationally Determined Contribution (NDC) has the ambitious goal of achieving a 50-52% emission reduction and creating 100% carbon pollution free electricity by 2035.
Clean hydrogen will be utilized in three sectors in the U.S.: industry, transportation, and electricity generation. Figure 2 illustrates clean hydrogen resources, distribution infrastructure, and storage options for end users.
Based on several rigorous models for the U.S., clean hydrogen production will increase significantly from nearly zero today to 10 MMT per year by 2030, 20 MMT per year by 2040, and 50 MMT per year by 2050. This continual rise will result in a total GHG emissions reduction by approximately 10% relative to 2005 levels.
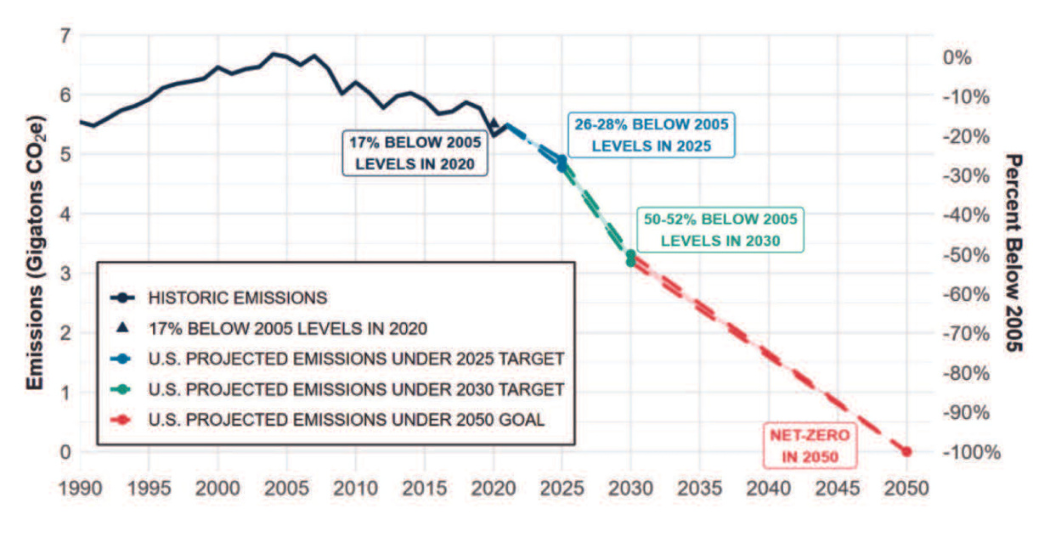
Figure 1: The U.S long term strategy to Net Zero by 2050. Image credit: htt ps://www.white-house.gov/wp-content/ uploads/2021/10/US-Long-Term-Strategy.pdf.
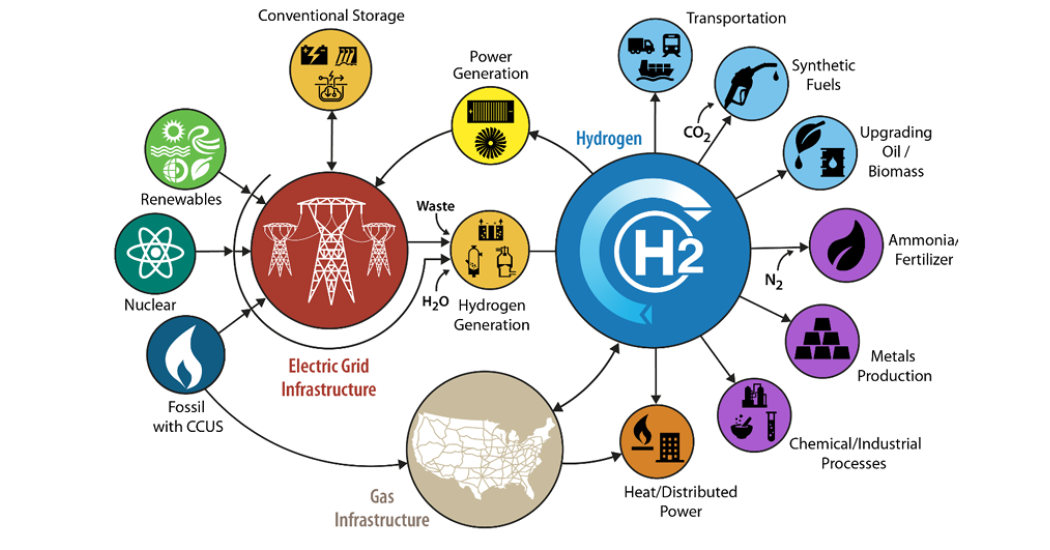
Figure 2: Image credit: https://www.eia.gov/energyexplained/hydrogen/production-of-hydrogen.php.
U.S. National Clean Hydrogen Strategy and Roadmap
The U.S. National Clean Hydrogen Strategy and Roadmap has been published by DOE as a framework with the vision to reach Net Zero by 2050. It also hopes to achieve a sustainable, resilient, and equitable economy with affordable production, distribution, storage, and use of clean hydrogen.
1. The strategy and roadmap are based on prioritizing three key strategies:
Target strategic, high-impact uses for clean hydrogen:
With a focus on the areas that are difficult to decarbonize for some industrial applications such as chemicals, steel market, and industrial heat, transportation such as medium and heavy-duty. Also a focus on the power sector with applications for electricity generation, energy storage, stationery, and backup power plants.
2. Reduce the cost of clean hydrogen:
The levelized cost of hydrogen must be reduced significantly. The U.S. clean hydrogen strategy focuses on reducing hydrogen production cost to USD $2 per kg by 2026 and USD $1 per kg by 2031. It also wants to reduce the delivery and dispensing cost to USD $2 per kg by 2030. As shown in Figure 4, the hydrogen shot (USD $1/1kg/1 decade) will impact a wide range of end users.
3. Focus on regional networks:
The following seven Regional Clean Hydrogen Hubs (H2Hubs) have announced that they intend to develop a national network of clean hydrogen producers and consumers:
- Appalachian Hydrogen Hub (Appalachian Regional Clean Hydrogen Hub (ARCH2); West Virginia, Ohio, Pennsylvania)
- California Hydrogen Hub (Alliance for Renewable Clean Hydrogen Energy Systems (ARCHES); California)
- Gulf Coast Hydrogen Hub (HyVelocity H2Hub; Texas)
- Heartland Hydrogen Hub (Minnesota, North Dakota, South Dakota)
Mid-Atlantic Hydrogen Hub (Mid-Atlantic Clean Hydrogen Hub (MACH2); Pennsylvania, Delaware, New Jersey) - Midwest Hydrogen Hub (Midwest Alliance for Clean Hydrogen (MachH2); Illinois, Indiana, Michigan)
- Pacific Northwest Hydrogen Hub (PNW H2; Washington, Oregon, Montana)
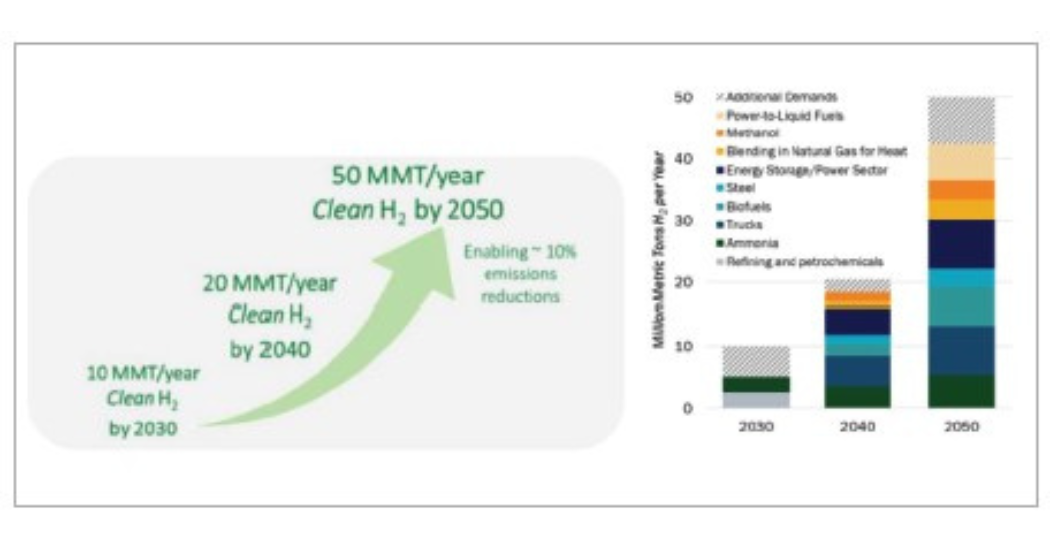
Figure 3: Image credit: https://www.hydrogen.energy.gov/docs/hydrogenprogramlibraries/pdfs/us-nati onal-cleanhydrogen-strategy-roadmap.pdf.
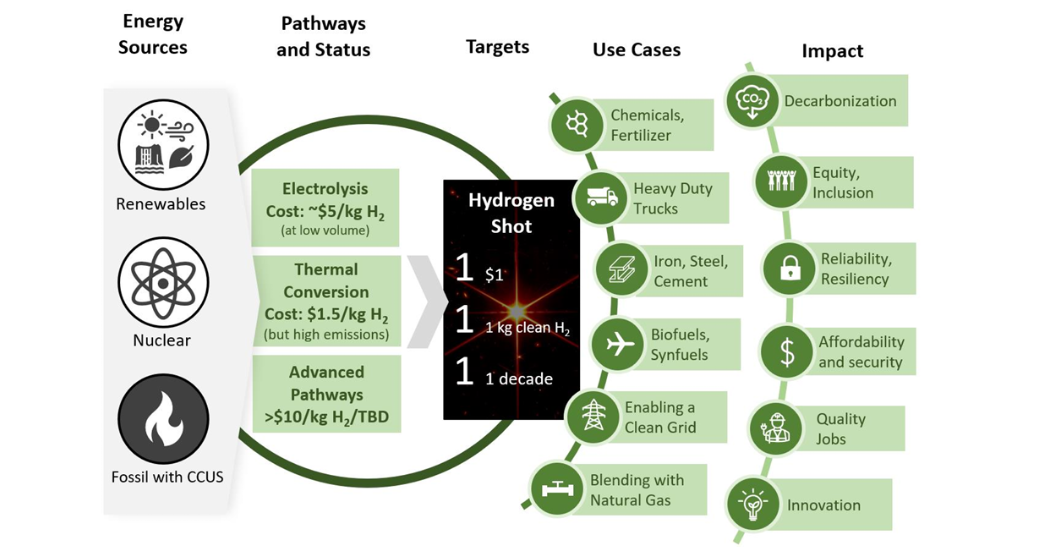
Figure 4: Image credit: https://www.hydrogen.energy.gov/docs/hydrogen-programlibraries/pdfs/us-nati onal-cleanhydrogen- strategyroadmap.pdf.
Hydrogen Production Technologies
The most common methods for hydrogen production are natural gas reforming and electrolysis. Solar-driven methods and biological process are in the early stages of development and will likely be cost-effective and commercialized in the decade ahead.
Thermal Processes
Natural gas reforming, coal gasification, biomass gasification, and reforming of renewable liquid fuels involve thermal processes to produce hydrogen. Currently, most hydrogen in the U.S. is produced by steam methane reforming without a carbon capture process. This process is very carbon intensive and pollutant. The U.S. Department of Energy does not use a color code for hydrogen production however gray hydrogen refers commonly to hydrogen production from fossil fuel resources without a carbon capture process since CO2 is released to the atmosphere.
Steam-methane reforming is an endothermic process in which high-temperature steam with 1,300°F to 1,800°F under 3 bar–25 bar pressure reacts with methane in the presence of a catalyst and produces hydrogen, carbon monoxide, and carbon dioxide (CO2):
Steam-methane reforming reaction:
CH4 + H2O (+ heat) –>CO + 3H2
The partial oxidation process is another process to generate hydrogen from natural gas. This process is exothermic (it gives off heat) but has a lower hydrogen generation rate compared to steam reforming of the same fuel.
Partial Oxidation of Methane Reaction:
CH4 + ½O2 –>CO + 2H2 (+ heat)
For both methods, in the ‘water-gas shift reaction’, the carbon monoxide and steam are reacted using a catalyst to produce carbon dioxide and more hydrogen:
CO + H2O –> CO2 + H2 (+ small amount of heat)
The final process is ‘pressure-swing adsorption’. Carbon dioxide is removed from the gas stream to have pure hydrogen. If the carbon capture process is added to hydrogen production to avoid releasing CO2 to the atmosphere, the hydrogen can be considered carbon-neutral and called ‘blue hydrogen.’
Electrolytic Processes
Green hydrogen is produced through the water electrolysis process by using renewable electricity to decompose water into hydrogen and oxygen which has no CO2 emissions. Electrolyzers consist of an anode and a cathode separated by an electrolyte. The two main methods are Polymer Electrolyte Membrane (PEM) Electrolyzers and Alkaline Electrolyzers.
In a Polymer Electrolyte Membrane, (PEM) electrolyzer, per Figure 5, the electrolyte is a solid special plastic material. It conducts protons from the anode to the cathode and prevents the flow of electrons from the anode to the cathode. Water reacts at the anode to generate oxygen and positive hydrogen ions (protons). The electrons then flow through an external circuit and the hydrogen ions selectively move across the PEM to the cathode. The hydrogen ions at the cathode combine with electrons from the external circuit to generate hydrogen gas.
Alkaline electrolyzers, per Figure 6, use a liquid alkaline solution of sodium or potassium hydroxide as the electrolyte to transport of hydroxide ions (OH-) from the cathode to the anode. Hydrogen is generated on the cathode side.
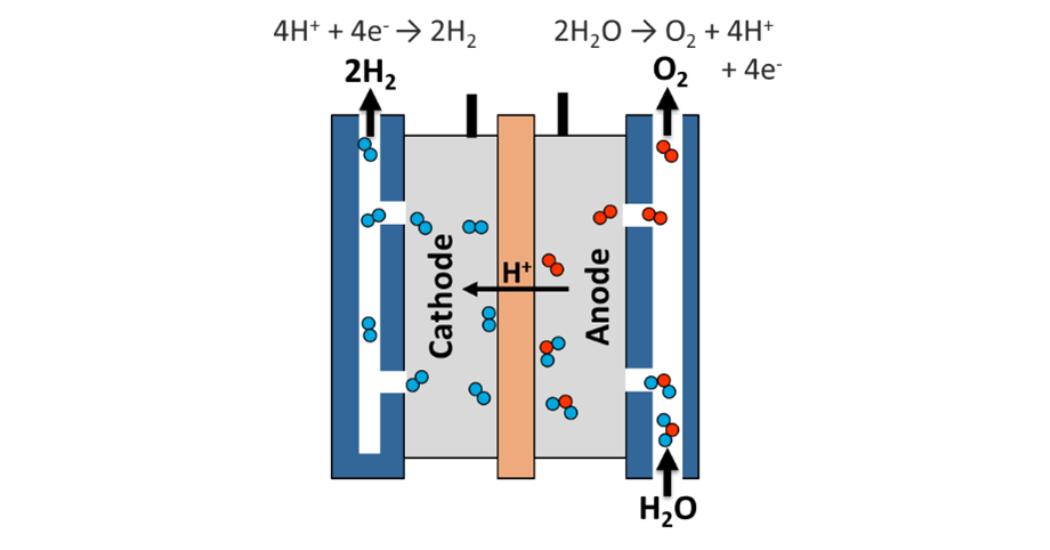
Figure 5: Polymer Electrolyte Membrane (PEM). Image credit: https://www.energy.gov/eere/ fuelcells/hydrogen-production-electrolysis.shop.pdf.]
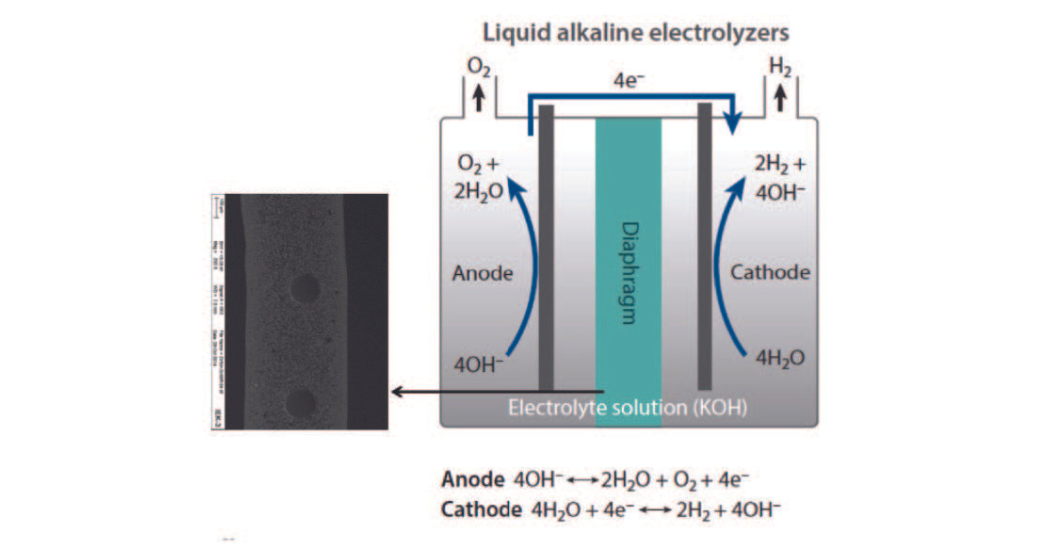
Figure 6: Alkaline electrolyzers. Image credit: https://www.energy.gov/sites/default/files/2022-02/2-Intro-Liquid-Alkaline-Workshop.pdf.
What is Considered Clean Hydrogen?
Hydrogen is a clean fuel and only produces water when it is burnt in fuel cells. The lack of emissions does not, however, mean hydrogen production and transportation to the end user is a clean process. Clean hydrogen can be produced through various pathways and the emissions intensity of each of these pathways depends on variables such as carbon capture, fugitive emissions, and the use of clean electricity.
Figure 7 shows the well-to-gate (emissions through the point of production) carbon intensity of hydrogen production from steam methane reforming and electrolysis based on current U.S production.
DOE’s Greenhouse Gases, Regulated Emissions, and Energy Use in Transportation (GREET) model has been used to specify the carbon intensity of each production method. For example, well-to-gate emissions of SMR with CCS depend on the fugitive emissions and capture rate. The carbon intensity of well-to-gate emissions of electrolysis is two times of SMR in current production and power resources. However, it will drop to zero when the electricity supply is 100% carbon pollution free which is the U.S.’s goal by 2035.
Clean Hydrogen Production Standard (CHPS) by DOE has established a target for well-to-gate lifecycle greenhouse gas emissions of ≤4.0 kgCO2e/kgH2 for hydrogen production during the taxable year. Figure 8 provides an example of the well-to-gate system for clean hydrogen production.
Per DOE’s guidelines, the model includes emissions from the upstream process, delivery to a hydrogen production facility and process, the electricity and any capture process, and the sequestration of carbon dioxide (CO2) generated during hydrogen production. Other greenhouse gases such as methane (CH4) and nitrous oxide (N2O) should be considered in the model evaluation by using equivalent global warming potential (GWP) to calculate equivalent CO2.
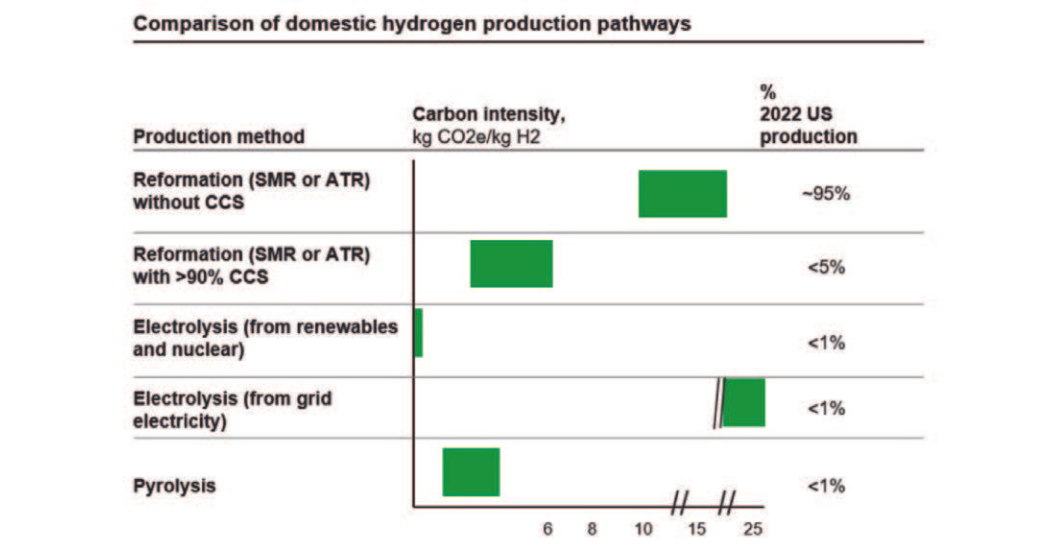
Figure 7: Image credit: https://www.hydrogen.energy.gov/docs/hydrogenprogramlibrar-ies/pdfs/us-national-clean- hydrogen-strategy-roadmap.pdf.]
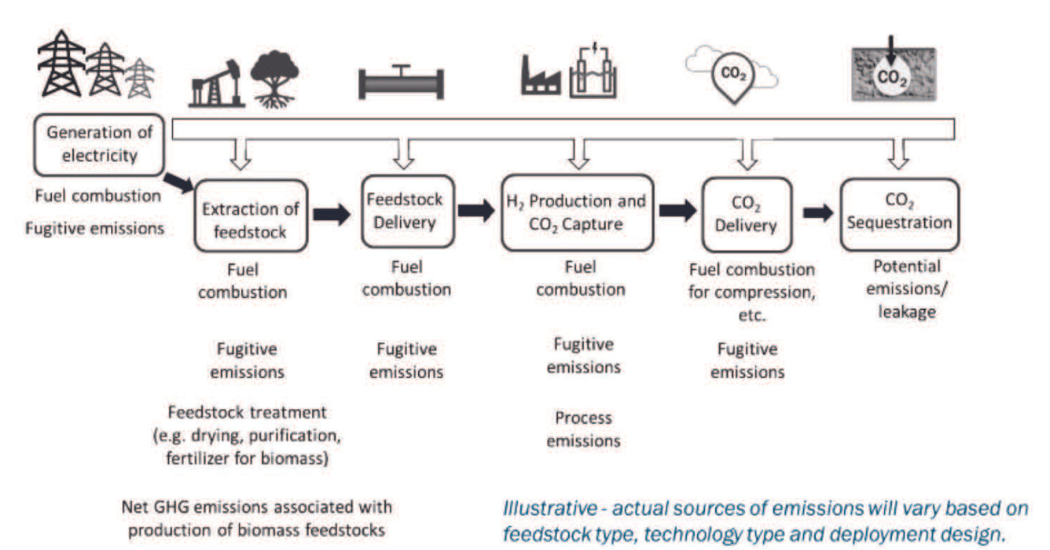
Figure 8: Image credit: https://www.energy.gov/sites/default/fi les/2023-12/greet-manual_2023-12-20.pdf.
Conclusion
Clean hydrogen plays a significant role in the objective to achieve net zero by 2050. The U.S. national clean hydrogen strategy and roadmap, and clean hydrogen production standard (CHPS), were published in 2023 to provide guidelines to hydrogen production, supply chain, and utilization in the U.S.
Targeting high impact clean hydrogen users and reducing the cost of clean hydrogen with focus on regional hydrogen networks, ensure the utilization of hydrogen even when decarbonization is not an easy process. Increasing market demand for hydrogen as a clean fuel will cause significant increase in the production based on advance technologies by thermal or electrolytic process; 10 million metric tons (MMT) of clean hydrogen annually by 2030, 20 MMT annually by 2040, and 50 MMT annually by 2050. It will help to reduce U.S. emissions by approximately 10% by 2050 relative to 2005.
REFERENCES
- https://www.iea.org/energy-system/low-emissionfuels/hydrogen
- https://heat-exchanger-world.com/wp-content/uploads/sites/19/2022/04/Jabbari.pdf
- https://www.hydrogen.energy.gov/docs/hydrogenprogramlibraries/pdfs/us-nationalcleanhydrogen-strategy-roadmap.pdf
- https://www.energy.gov/sites/default/ les/2023-12/greet-manual_2023-12-20.pdf
- https://www.energy.gov/eere/fuelcells/hydrogenfuelbasics
- https://www.energy.gov/eere/fuelcells/hydrogenproduction-natural-gas-reforming
- https://www.energy.gov/eere/fuelcells/hydrogenproduction-electrolysis
- https://www.energy.gov/sites/default/ les/2022-02/2IntroLiquid%20Alkaline%20Workshop.pdf
- https://www.hydrogen.energy.gov/docs/hydrogenprogramlibraries/pdfs/cleanhydrogenproduction-standard-guidance.pdf
ABOUT THE AUTHOR
 Naomi is Heat Transfer Engineer for S&B Engineers and Constructors, LTD in Houston with Bachelor of Science in Mechanical Engineering and Master of Science in Energy. She is the former chair and vice chair of Heat Exchanger World Americas conferences, vice chair of HTRI (Heat Transfer Research Inc.) Communication Committee in Houston and steering committee member for Valve World Americas Conference and Fugitive Emissions Summit. Her areas of interests are heat transfer, new technologies to reach Net Zero by 2050 goals and clean energy such as hydrogen production, carbon capture technology and biofuels for sustainable energy production.
Originally posted on Fugitive Emissions Journal
Watch Naomi’s presentation at the Sustainability Summit on demand.