Proper selection of centrifugal pumps is more important than ever. Getting it wrong can have drastic consequences on maintenance, reliability and efficiency. However, the selection process remains difficult for many users. Even contracting the work out to a reputable engineering firm brings no guarantee of success. What it takes is a firm understanding of centrifugal pump design, the common pitfalls involved in the selection process, and the consequences of improper selection.
Centrifugal pump technology is relatively mature. It has been around for quite some time without any revolutionary changes. Certainly, there are new alloys and coatings for casings and impellers, and efficiencies have increased. However, their basic design remains largely unchanged over a considerable period. A centrifugal pump from 100 years ago is nearly identical to modern designs. If anything, older designs are more robust than those on competitive market currently due to pump manufacturers cutting costs by eliminating excess material.
Additionally, the pump’s application plays a critical role. A high-quality pump from a reputable manufacturer may perform poorly in certain systems. Even an expensive model made from titanium and designed to NASA specifications for a 30-year life cycle could perform inadequately for certain industrial applications. To fit the right pump to the right application, it is necessary to dig into the basic operating points of centrifugal pumps.
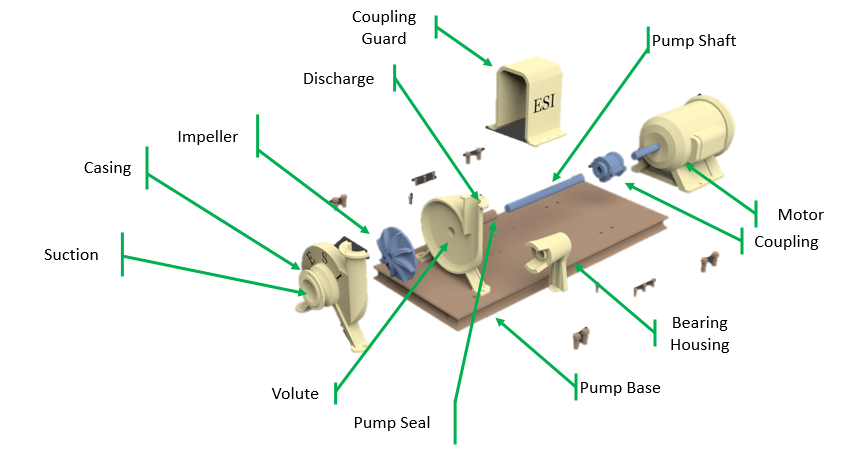
Pump design (see Figure 1 above)
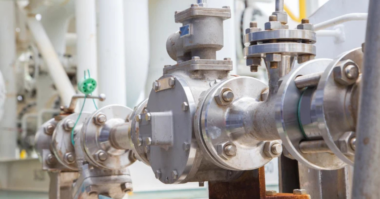
As the pump shaft spins, it turns the impeller inside the casing which adds energy into the process fluid. This allows the impeller to act as a cantilever with a wear ring, seals, and bearings that keep everything in place and fluid from leaking out. The spinning impeller changes the incoming fluid’s direction which can cause intense radial loads on the pump. The bearings not only reduce rolling friction, but support the pump shaft and absorb these radial loads (Figure 1).
All pumps have a design point where efficiency is maximized, known as the Best Efficiency Point (BEP). This is where the pump runs the smoothest and radial forces are minimized. The further away from the BEP, the higher the radial loads on the pump. The pump, however, will generally have a critical speed around 25% over the BEP where its natural frequency is reached and excessive vibration may occur. What this means, in essence, is that the pump will shake itself apart, first going through the wear ring, then the seals, and finally the bearings. This is easy to spot; the pump will vibrate and may begin leaking fluid well before the next scheduled maintenance period.
This is akin to driving a car with the wheels out of balance. When mud or ice are stuck to one side of the rim, imbalance can result. The car may run fine at 25 mph in the city. However, as the speed increases it will reach a point where the impulses from the wheels work in tandem with the shock absorbers, causing the entire vehicle to shake until the offending speed is passed.
The BEP, therefore, should be fully understood as part of the selection of centrifugal pumps. Pump curves demonstrate the strong relationship between pump life, pump reliability, and where the pump operates on its curve. The performance of individual pumps is a combination of design and operating conditions. The pump’s performance data is provided to the user in the form of pump curves, whose primary function is to communicate or define the relationship between the flow rate and total head for a pump. They are provided by the manufacturer and show the operating characteristics of a specific pump type, size, and speed based on the results from standardized tests and test conditions. A healthy pump maintains the defined relationship between the head and flow at all times.
The pump curve is required for:
- Proper pump selection: Using a pump curve will ensure the pump selected is matched to the system requirements
- Monitoring pump health: If the pump is not operating on the published curve then something is wrong
- Troubleshooting the entire piping system: The pump provides energy into the system. Knowing the energy coming in is a critical clue for the identification of issues. Without a pump curve, it is extremely difficult to determine what is causing a problem in the system and what should be done to correct it.
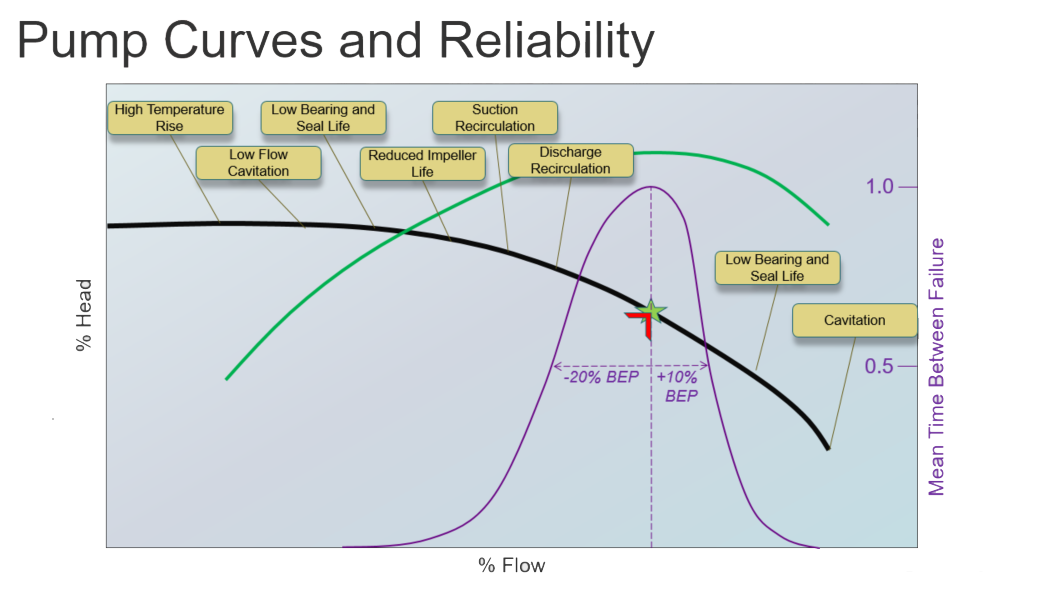
Figure 2: A stylized pump curve in black with efficiency in green. The Barringer Curve in purple shows the relationship between the pumps operation and MTBF.
For the sake of accuracy, it is critical to have a pump curve for every pump. As mentioned earlier, the peak or maximum efficiency on the pump curve is indicated by the BEP. To operate on the BEP, the system must either control the pressure at the outlet of the pump or the flow through the system to keep the pump operating point (indicated by the red arrow) on that spot.
For example, if the system causes the pressure at the discharge to surpass the pressure at the BEP, the operating point will move to the left up the curve and flow will reduce. If, though, the system causes the pressure at the pump’s discharge to drop the operating point will move down and to the right. Moving to the left or right of the BEP causes forces on the impeller to increase. These forces cause stresses which have a negative effect on the life and reliability of the pump.
If we overlay the expected life of the pump as a function of where the pump is operating, we get a “Barringer Curve”, which shows the Mean Time Between Failure (MTBF) as a function of BEP flow rate. This curve was created by Barringer & Associates in a study of seal failures in centrifugal pumps.
Using the curve above, the closer the pump is operated to its BEP, the greater the MTBF. As the operating flow rate of the pump moves farther to the left or right of the BEP, failures occur more frequently. MTBF is cut in half when the pump is running 20% below the BEP, or 10% above it. When operated to the left of the BEP, problems like a temperature rise, low flow cavitation, bearing issues, reduced impeller life, and suction and discharge recirculation can lead to seal failure and pump downtime. To the right of the BEP, bearing and seal life are also impacted, and cavitation problems occur.
As part of the selection process, a user must attain a firm understanding of how the system impacts the pump on its curve. Reliability and pump life is much higher when the pump operates near the BEP.
RELATED ARTICLE: Engineering Resilience in a Turbulent World
Pump cavitation
Cavitation is another concern in pump selection. Its presence can demolish pumps rapidly. If there is a low intake pressure, or the pump is operating at the far end of its curve, it pulls the fluid through so rapidly that the fluid pressure drops below its vapor pressure. When this occurs, there is no longer sufficient pressure on the fluid to keep it in a purely liquid state. The fluid appears to boil for a brief instant, and this is called cavitation.
At sea level, for example, water boils at 212°F. At The top of Mount Everest where the pressure is much lower, it boils at 160°F. In a pump, the pressure may drop low enough that water “boils” at 60°F, or whatever the ambient temperature may be. It may seem difficult for air to strip away steel in a pump, but it’s the millions of vapor bubble explosions and implosions that do the damage. This effect is clear once the pump is in operation. Cavitation can sound like gravel being pumped no matter the base fluid.
How does this tie in to pump selection? Some users try to avoid pump challenges by spending extra money on an oversized pump. However, this may cost more money in terms of maintenance and repairs as the operating point could be far from the BEP.
After all, the state of individual process piping is generally unknown. Thus engineers tend to oversize pumps in an attempt to build in a margin of safety. They have no real idea how a contractor will route pipes, and add a safety factor into their calculations. This safety factor, however, generally goes on top of the worst-case design scenario. Engineering firms are incentivized by the fact that they do not want to be blamed for an undersized pump that cannot meet process requirements. Imagine the outrage and damage to a firm’s reputation if clients did not receive adequate water pressure from a shower, cooling from the HVAC, or flow from the sewers.
The general rule of thumb for safety factors is 10%. A junior engineer will generally assume a certain amount of required energy based on the expected piping, process, and control elements. To that number will be added 10%. A senior engineer may then review this work and add an additional 10%, just in case. Things can continue to become even more complicated as end users may introduce unrealistic expectations for production capacity or may want the infrastructure being put in place as part of a potential expansion project that is still years down the road.
When the pump is finally ordered, the manufacturer’s representative will help select one that is large enough to handle these operations and then some. These safety factors end up compounding on each other and the actual process inherits something totally different than that which was originally required. This may leave the end user saddled with an inefficient pump and the possibility of hundreds of thousands of dollars in additional energy usage and maintenance work. Using software to model expected flow conditions at various operating points is recommended as a safeguard against such excesses.
Pumping System Optimization is a course by the Hydraulic Institute with part covering an evaluation of 1690 pumps at 20 process plants. The study discovered some alarming results. It found average pumping efficiency to be below 40%. Additionally, over 10% of pumps were less than 10% efficient. A major reason behind such poor numbers was improper pump selection.
These findings should be appreciated in the context of pump economics. The general rule is that a pump and motor combo will cost about $1 per day per horsepower of the motor. While energy costs vary by location, this is a good starting point to begin understanding the potential costs being facing. For larger horsepower pumps running inefficiently, the wasted capital can be staggering.
But energy costs alone are seldom cause for change, much less transformation of an industry. Once the pumps are installed and running, the energy costs can sometimes be out of sight and out of mind. On top of that, there are many other costs in industrial facilities. Discovering the true cost of the pump is hard when it is buried in an industrial energy bill alongside the high costs of heating, cooling, and running of the equipment.
Designing a fully optimized system without unnecessary safety margins can offer energy savings, better process quality and quantity. However, software evaluation of existing pumps can bring to light slight changes that can be made to the system that may result in sizeable increases in production throughput.
Reliability and reduced maintenance generates some of the biggest savings when the pumping system is running correctly. From the Barringer curve we can see that we must operate close to the pump’s BEP in order to maximize our efficiency and the MTBF. Reputable pump manufacturers design their pumps to operate for 20 or more years if done correctly. Some users are satisfied with five years of pump life. The opportunity from better maintenance and reliability alone, warrants a second look at pump and system efficiency.