Author: Ray Hardee, Engineered Software Inc.
When the demands of a pumping system changes, many elements must be thoroughly reviewed to ensure that the system operates as required and with maximum efficiency.
Increasing System Flow Rate
In the late ’90s I was working with an electrical utility in British Columbia that had a program to help its large utility customers reduce their plants’ energy consumption. The utility would evaluate a customer’s pump systems to see what could be done to reduce energy consumption.
I got a call from the consultant performing the analysis on a water makeup system in a nickel mine, where water was pumped from a river to the mill through a 5-mile-long pipeline. Over the years, the plants’ river water requirements increased. The sales engineer for the vertical turbine pump manufacturer was called in each time. The increased system capacity was accomplished by adding stages to the existing vertical turbine pumps, as well as adding new pumps. When I was called, four vertical turbine pumps were providing approximately 4,100 gallons per minute (gpm) of river water to the mine with a fifth pump in standby.
The Total System
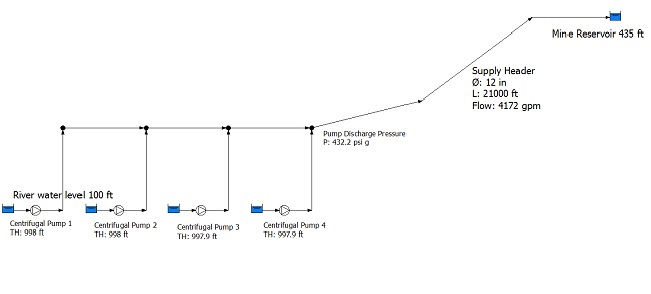
The utility’s consultant modeled the river water system using a commercially available piping system simulation program. The river water level was 100 feet above sea level and the elevation of the mine reservoir liquid level was 435 feet. The supply header was 12-inch steel schedule 40 pipe with a length of 21,000 feet from the river to the mill. The consultant built the system model and asked me if I would look at his results (see Figure 1).
The first thing I asked was if he had an accurate pump curve for the installed vertical turbine pumps. He did and provided me with a copy (see Figure 2).
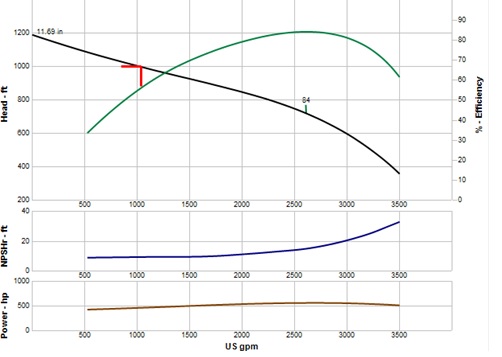
Figure 2. Pump curve for one of four identical 10-stage vertical turbines for the river water system
Figure 2 Pump Curve in mine example
I then asked how the model’s calculated results matched the physical system. He said the only system instrumentation was a pressure on the pump discharge header reading 430 pounds per square inch (psi), which closely matched the simulation’s calculated results. He also mentioned that he double-checked the river and tank elevations, pipe lengths and pipe diameters based on existing design documents, and they were correct.
The fact that he had a manufacturer’s supplied pump curve and the actual pump discharge pressure closely correlated with the calculated pump pressure indicated the model closely correlated with the physical system. With an accurate system model, proposed system changes can be evaluated.
Each of the four pumps were supplying 1,043 gpm, which is within the manufacturer’s allowable operating range. But with the pump’s best efficiency point (BEP) flow of 2,600 gpm, this represents a flow of only 40 percent of the pump’s BEP flow—well outside of the preferred operating range recommended in the American National Standards Institute/Hydraulic Institute (ANSI/HI) 9.6.3-2012 Rotodynamic (Centrifugal and vertical) Pumps – Guideline for Allowable Operating Region standard. Running a pump this far away from its BEP can cause premature bearing and seal failure.
Next I looked at the flow rate through the supply header. With 4,200 gpm through the 12-inch diameter pipeline corresponding to a fluid velocity of 12 feet per second, the result was a dynamic head loss of 660 feet in the pipeline. This head loss added to the 335 feet of system static head results in a required pump head of 1,000 feet.
Considering the Options
The flow rate in the river water system needed to be increased to 4,500 gpm. As previously stated, a fluid piping system is made of the pump, process and control elements. Increasing the flow rate to 4,500 gpm in the existing system resulted in a head loss in the supply header of 767 feet or a total pump head of 1,102 feet. Each element affects the total system operation, and when people need to increase the system flow, their first thought is to call the pump manufacturer.
Pump Option
When the pump manufacturer was called he stated the existing pumps could not meet the head required for the new flow rate because the installed vertical turbine pumps were not designed for more than 10 stages. Additional pumps were not an option because there was no space in the pump house for the added pumps. As a result, the pump sales representative suggested replacing the existing pumps with higher-capacity pumps. The plant’s utility manager was concerned the larger pumps would increase the site’s electrical utility demand charges.
Process Option
In this system, the process elements consist of the river, mine reservoir and the interconnecting piping complete with valves and fittings. Because the fluid velocity in the 12-inch supply header was so great, it was decided to look into installing a new pipeline parallel to the existing pipe. This would allow for a greater flow rate and minimize the head loss in the supply header.
System Evaluation
The cost to operate the existing system with four pumps running 8,000 hours per year with a power cost of $0.03 a kilowatt/hour was approximately $358,000 per year. Installing a 20-inch pipeline in parallel to the existing supply header resulted in a head loss in the supply header of only 51 feet. As a result, the new pump head requirement was only 406 feet.
Discussions with the pump supplier determined that two of the existing pumps with only five stages per pump can deliver 2,350 gpm with 390 feet of head resulting in a total system flow rate of 4,700 gpm. The existing pumps have an efficiency of 83 percent at this flow rate, resulting in an annual operating cost of . This resulted in an annual energy savings of more than $250,000 across the existing system.
The cost to replace the five existing pumps with new, larger pumps to meet the increased system flow rate and head was in the same price range as adding the 20-inch pipeline. Because the addition of the pumps would do nothing to reduce the energy consumption of the existing system, the client decided to install the pipeline instead of considering the pump replacements.
After the client had installed the pipeline in parallel, I called the to see how the system changes turned out. He sent me an as-built model of the system, and I noticed that the last 3,000 feet of the new pipeline was 24 inches in diameter. I asked if there was a reason for the larger pipe diameter in the new pipeline. He responded that they had purchased all the 20-inch pipe in Western Canada and wanted to get the improvement made as quickly as possible, so they purchased 24-inch diameter pipe for the remainder. In addition, the utility documented savings of $250,000 in energy costs.
Using Flow Modeling
As you can see from this real-life example, flow modeling is not only useful when the need arises to meet increases in system demand, but also can help owners decrease their energy costs. There are fluid flow design and analysis software packages that exist to enable design engineers to create identical models of their specific systems. With a “digital twin” of a pumping or piping system, engineers can investigate how their system is operating, see pressures at every point within the system, understand flow rates at different points through their piping system, and determine how adjusting variables within that system might affect operation and efficiency of that system.
You are invited to try a *Free* Demo of PIPE-FLO® Professional from Engineered Software, Inc.