Author: Scott Lang, Applied Flow Technology
What comes to mind when you hear the expression “planning for failure”? For some, it carries the negative connotation that failure is the direct result of a design – intentionally or otherwise. Benjamin Franklin said, “If you fail to plan, you are planning to fail!” and I believe he would agree that any good plan addresses potential failures. In fact, not “planning for failure” as an element of a system is essentially failing to plan and therefore inviting unexpected and unmitigated failures.
Life Cycle Cost
One of the many reasons to avoid failure when possible is to reduce cost. When a pump fails, the monetary costs can be significant – not only to repair or replace the pump, but also due to lost production time.
Unfortunately, many pump selections are based almost entirely on initial cost. While initial cost is an important component, it is critical to consider the Life Cycle Cost (LCC) of the pump when making cost based decisions. The LCC accounts for all costs associated with the pump over its lifetime. Most intuitively, this includes items like the initial cost, routine maintenance, and energy cost.
Reliability
No system is immune to failure. Even though failure often accounts for a significant portion of the LCC, this cost is sometimes neglected. A true LCC estimate accounts for failure by approximating the Mean Time Between Repair (MTBR) and the cost associated with that repair. To decrease the LCC, it is desirable to increase the MTBR. Doing so can save thousands or even millions of dollars.
There are many aspects that affect the reliability of a pump (Erickson, Sabini, & Stavale, 2000):
- Type of Pump
- Installation (Alignment, piping strain, etc.)
- Application
- Mechanical (Seals, bearing, lubrication, etc.)
- Hydraulic
- Capacity (Percent of BEP)
- Speed
- Impeller Diameter
- NPSH Margin
- Operation (Start up & shut down, parallel operation, etc.)
- Maintenance (Training, tools, records, etc.)
For this discussion we will focus on the hydraulic components, but keep in mind that spending a lot of time designing around solely hydraulic parameters is not very effective if the other parameters are not also addressed!
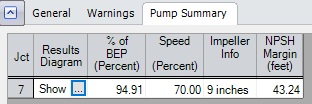
AFT Fathom can directly report these values, allowing the user to design to general guidelines such as remaining in the Preferred Operating Region for BEP.
While designing to these guidelines generally increases reliability, it can be difficult to say how much of an impact certain design choices have on reliability. This can be particularly difficult because changing one parameter such as operating capacity may affect the other parameters as well. Not only that, multiple configurations of a pump may have close to the same operating point – how should a choice between such configurations be made?
Reliability Factors
A solution is to use Reliability Factors. A Reliability Factor is a dimensionless value – 0 to 1 – that indicates the relative reliability of a certain configuration. They cannot be used to directly determine MTBR, a value of 0 does not indicate “zero reliability,” and a value of 1 does not indicate “perfect reliability.” It is important to note that these values are strictly relative – they have little meaning unless compared with values for another operating condition of the same pump.
The Reliability Factor data used in AFT Fathom (Bloch & Geitner, 1994) is shown below:
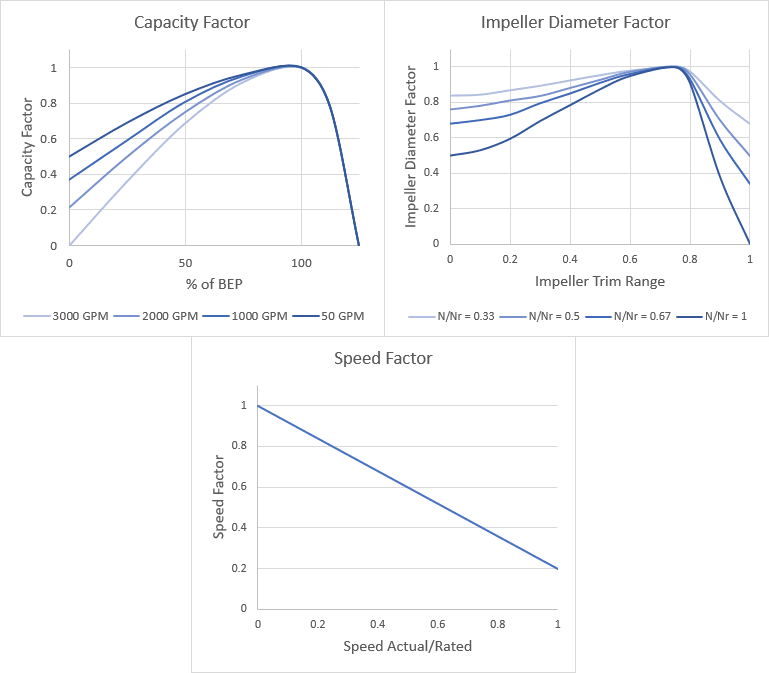
These curves correlate a certain parameter to an associated Reliability Factor. As can be seen in the Capacity and Impeller Diameter cases, it is found to be too much of a simplification to reduce the reliability curve to one variable, so multiple curves exist on a second variable. The Capacity Factor curve changes with the size of the pump (flow at BEP), and the Impeller Diameter Factor curve changes with the ratio of current speed over rated speed (N/Nr).
AFT Fathom needs certain data, listed below, about the pump to be able to calculate each factor. All of this data must be entered as part of a multiple configuration, which helps to mentally enforce the fact that reliability factors can only be used to compare differing operating configurations for the same pump.
- Capacity
- – Efficiency Curve
- Impeller Diameter
- – The maximum and minimum impeller diameters must be known, as well as the actual diameter. For this Reliability Factor, the maximum and minimum entered impeller diameters are assumed to define the trim range.
- Speed
- – Similarly, the rated speed must be known. It is assumed that the rated speed is the highest entered speed configuration.
When all of the necessary data is defined, each Reliability Factor can be calculated. In turn, a “Total” Reliability Factor can be calculated and reported, which is simply the product of the components:
Reliability Factors are useful for making a decision on what configuration would be best when other factors are equal or not as significant as reliable operation.
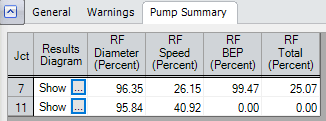
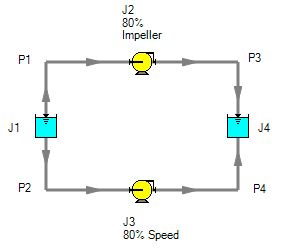
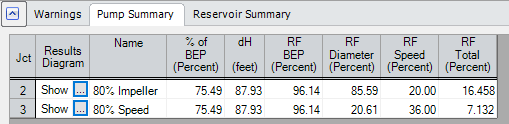
Simply meeting a design head and flow does not necessarily mean that the pump is at its most reliable configuration. For example, consider two identical pumps – one that is running at 80% of rated speed, and one that is running with impeller trimmed to 80% of the maximum size.
The affinity laws would state that the pump curves are identical for these two pumps. AFT Fathom reflects this by showing no difference in operating point between the two configurations. However, the Reliability Factors indicate that trimming the impeller would likely result in higher reliability and therefore lower LCC.
Notes on Using Reliability Factors
It is important to recognize that Reliability Factors provide only an estimate of what configuration would be best, and do not account for every possible impact on reliablity.
These types of curves are rarely based on statistical studies, but instead are developed in a testing environment. Measurable quantities known to correlate to reliability – Reliability Indicators – are observed over various operating ranges to correlate the Reliability Indicator to a design parameter such as pump speed. Reliability Indicators are typically values such as bearing temperature, impeller vane pass vibrations, or pressure pulsations at various locations.
The Bloch & Geitner curves used in AFT Fathom appear to have been developed with a relatively high suction energy pumps, which impacts the shape of the Impeller Diameter Reliability Factor curve. For low suction energy pumps, it appears that the Reliability Factor only increases as the impeller is trimmed, similar to the speed relationship (Stavale, 2008). The same study showed a maximum capacity reliablity slightly to the left of BEP, rather than directly at BEP as Bloch & Geitner shows.
There is no generally accepted Reliability Factor for the fourth hydraulic parameter mentioned – NPSH Margin (NPSHA/NPSHR). It is a common misconception that cavitation does not exist when NPSH Available is above NPSH Required. In reality, many pumps require an NPSH Margin from 1.1 – 2.0 to fully supress cavitation – in some pumps it may need to be as high as 20! (Stavale, 2008) In addition, this small amount of cavitation may or may not cause a reduction in MTBR. If, for example, the fluid has a small amount of entrained air, the negative effects of this cavitation can be significantly reduced. (Budris & Mayleben, 1998) It is important to address NPSH Margin if reliability is a prime concern, and it is never good practice to simply be “above” NPSHR without concern for the available margin.
 TRY A FREE DEMO!
Conclusion
The notes above are not intented to instill doubt about the usefulness of Reliability Factors. On the contrary, the studies the authors completed for the most part show similar trends on several different pumps. The important thing for the engineer to remember is that true reliability is very complex with many contributing factors – trying to boil any complex behavior down to a single number is bound to require simplifications that the engineer should be aware of.
With this in mind, AFT Fathom and its reliability tools are great for ensuring that your pump selections are as reliable as they can be. Even when the system is hard to intuitively understand or there are competing design parameters, AFT Fathom helps to guide an engineer by providing a quick and easy to interpret qualitative measure of reliability.

Learn pipe flow analysis and system modeling in upcoming webinars!
About the Author
As an AFT Applications Engineer, Scott Lang helps customers troubleshoot their models and lends a hand with the development and implementation of training materials. Scott is a certified Engineer in Training and holds a Bachelor of Science in Mechanical and Electrical Engineering (2011) from Colorado School of Mines. See more from Scott Lang!
References
Bloch, H. P., & Geitner, F. K. (1994). An Introduction to Machinery Reliability Assessment. Houston, Texas: Gulf Publishing Co.
Budris, A. R., & Mayleben, P. A. (1998). Effects of Entrained Air, NPSH Margin, and Suction Piping on Cavitation in Centrifugal Pumps. Proceedings of the 15th International Pump Users Symposium (pp. 99-108). Houston, Texas: Turbomachinery Laboratory, Texas A&M University.
Erickson, R. B., Sabini, E. P., & Stavale, A. E. (2000). Hydraulic Selection to Minimize the Unscheduled Maintenance Portion of Life Cycle Cost. Pump Users International Forum. Karlsruhe, Germany.
Stavale, A. E. (2008). Reducing Reliability Incidents and Improving Meantime Between Repair. Proceedings of the Twenty-Fourth International Pump Users Symposium. Houston, Texas.