Ingenero Technologies engineers Santosh Kumar and Swapnil A Paingankar were tasked with analyzing a petrochemical cooling water system which was unable to meet system design requirements. Insufficient cooling water supply limited plant capacity, thus reducing the profitability of the plant. The team performed their hydraulic analysis in AFT Fathom, revealing the shortcomings of the existing system and providing design alternatives to return to design capacity.
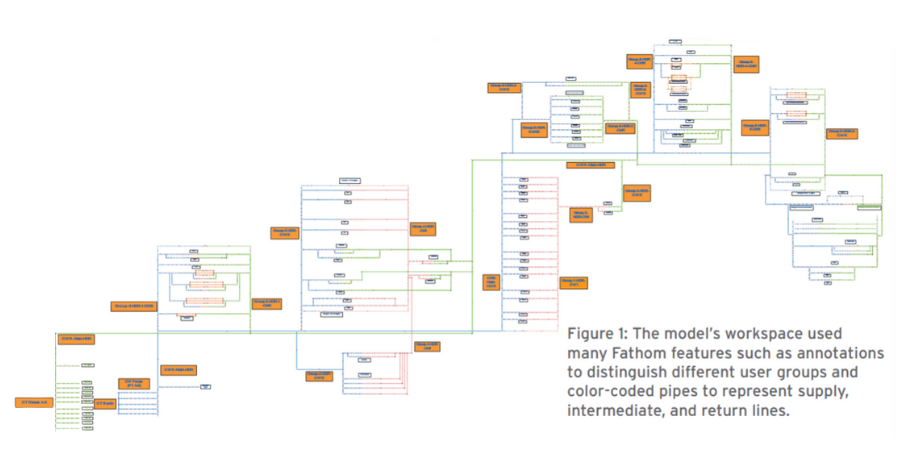
Kumar and Swapnil’s analysis began by collecting design data provided by the client. This data included isometrics of the network, P&IDs of the system, and many component datasheets for pumps, valves, and heat exchangers to accurately translate the system into Fathom. Other component information such as valves characteristics, heat exchanger resistance curves, and flow meter resistance curves were implemented using field data in built-in Fathom features. The final model is found in Figure 1 with its color-coded supply and return lines, annotating the different consumer user groups.
In addition to design information, survey data for critical consumers was collected in the field to validate software results. The team found flow rate deviation between model predictions and survey data was often within the acceptable +/- 10% range. Similarly, pressure deviations were within +/- 5% for the available measurements.
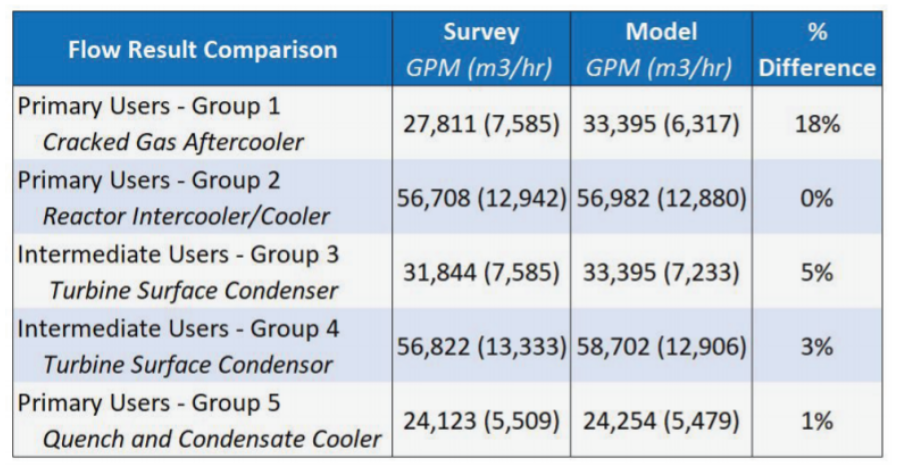
Table 1: The comparison between flow survey results and modeled results indicated reasonable correlation and trustworthy model results.
The exact flow and pressure variation in each user group is found in Tables 1 and 2 respectively, highlighting the validity of the model. Components of the model solely specified from design information had larger variance, likely indicating performance deterioration as the system aged.
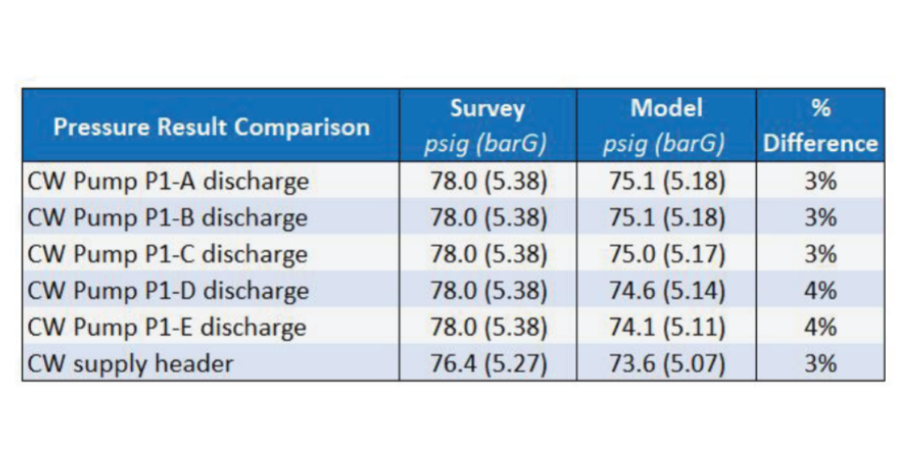
Table 2: Pressure surveys for pump discharge correlated with model results even more so than flow results.
Model analysis also revealed the system’s main header flowmeter was miscalibrated, reporting 14,000 GPM (3,200 m3/hr) more than the summation of individual readings, roughly a 10% deviation. The summation of individual values aligned with AFT Fathom determined flowrates, and the flowmeter was thus corrected.
Following calibration, analysis of the model indicated several consumers with much greater
pressure drop than was designed. In some cases, a consumer saw a pressure drop of 2.5 kg/cm2 (35.5 psid, 2.54 bar), more than 5 times the designed pressure drop of 0.5 kg/cm2 (7 psid, 0.48 bar). The team cites AFT Fathom’s Visual Report for accelerating the analysis of the system, allowing them to focus on specific problem areas to simulate, observe, analyze, fix, and validate their proposals.
The team’s proposals were determined from sensitivity analysis in AFT Fathom, exploring configuration changes such as valve setting, replacing components, and variable pump operation. By replacing a particular consumer group, hydraulic analysis revealed the client could reduce the number of operating parallel pumps and still meet demand. Operating 4 of the existing 5 pumps would improve operational flexibility (with the optional standby pump which could increase capacity) and reduce power consumption, increasing the plant’s profitability.
The team also considered increasing pump impeller diameter, shifting the composite pump curves and potential operating points. With options to change the number of pumps running, impeller diameter, system configurations, or a combination of all the above, the team relied on Fathom’s pump-system curves to easily determine system operation. Figure 2 below explores running various pumps for different system configurations. Multi-Scenario pump-system curves concisely condense potential operating points for a system to a single figure, especially useful during sensitivity analysis.
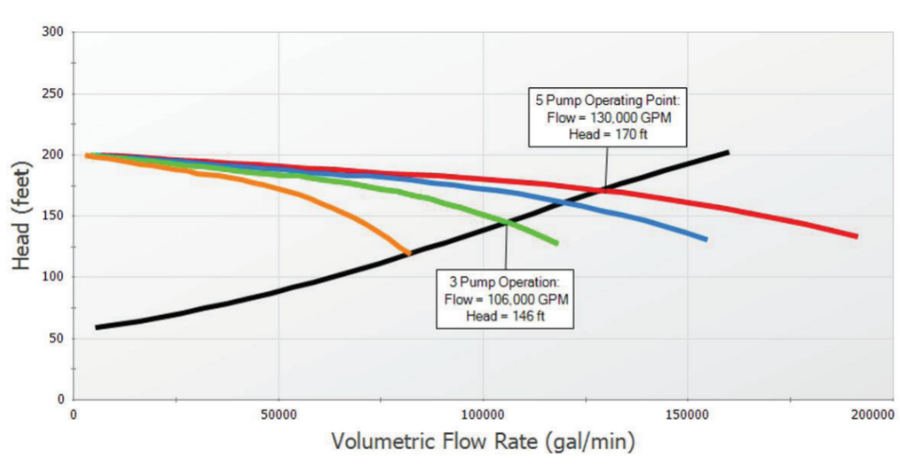
Figure 2: Multi-Scenario pump-system curves allowed the engineers to view the diverse operating points found by selectively running pumps in parallel.
Through their diverse analysis in AFT Fathom, Kumar and Paingankar were able to easily calibrate, quickly understand, and intuitively visualize how the system would react to their changes. AFT Fathom accelerated their progress toward a resolution, ensuring their customer was able to recover their lost production while lowering operating costs in the process.

Comments