Author: Dan Meckstroth
Executive Summary
Manufactured goods are ubiquitous at home, in transit, and at work, but the narrow definition of manufacturing industries in national statistics implies that the sector is of only minor importance to economic activity. The traditional finding is that manufacturers’ proportion of gross domestic product (GDP) is only about 11% and manufacturing’s share of economy-wide full-time equivalent employment is just 9%. Since this excludes manufacturing activities such as research and development, corporate management, logistics operations, and advertising and branding, those figures are merely the tip of the iceberg.
The MAPI Foundation finds that manufacturing’s footprint is much larger than merely the value-added at the factory loading dock. Manufacturing plant activities lie near the center of a substantial and complex value chain that is composed of an upstream supply chain that gathers materials and services and a downstream sales chain that moves goods to market and sells and services goods. Manufactured goods are also intermediate inputs in nonmanufacturing industries’ supply chains.
The MAPI Foundation’s major findings:
- The manufactured goods value chain plus manufacturing for other industries’ supply chains accounts for about one-third of GDP and employment in the United States.
- The domestic manufacturing value-added multiplier is 3.6, which is much higher than conventional calculations. For every dollar of domestic manufacturing value-added destined for manufactured goods for final demand, another $3.60 of value-added is generated elsewhere.
- For each full-time equivalent job in manufacturing dedicated to producing value for final demand, there are 3.4 full-time equivalent jobs created in nonmanufacturing industries.
- Most (54%) of the value-added in manufactured goods destined for final demand is from the downstream sales chain; the upstream supply chain accounts for the remaining 46%.
- Domestic manufacturing accounts for only 22% of the value chain of manufactured goods for final demand. Nonmanufacturing value-added is 53% and imports are another 25%.
- 60% of manufacturing imports ($1,024 billion) are final goods; these directly enter the downstream sales chain. The other $694 billion of manufacturing imports enter the value stream in the upstream supply chain of domestic manufacturing.
- Relative to other industries, manufacturing is efficient in delivering value-added. It takes about 5.8 full-time equivalent manufacturing jobs to achieve $1 million in value-added, compared with 7.7 for both transportation and services and 16.9 for retail trade.
Introduction
Manufacturing Encompasses More Than Just Factories
Manufacturing industries are a fundamental part of our economy, but national statistics suggest they are of only minor importance. In particular, the economic statistics say that manufacturing’s proportion of final demand or gross domestic product is only about 11% and its share of total employment is just 9%.
As measured by our spending, however, manufacturing certainly seems to be more important than 11% of the total market value of goods and services produced in the economy. We see physical goods surrounding us at home, in transit, at work, and at play. Businesses and governments invest in equipment as well as structures built from manufactured construction materials. Further, a sizable majority of U.S. exports are manufactured goods.
The MAPI Foundation finds that manufacturing’s footprint is much larger than merely the value-added at the factory loading dock. The sector has both an upstream supply chain that includes networks of scientists and engineers, specialized material suppliers, equipment, transportation, and other service providers plus a downstream sales chain that includes logistics and a global assortment of wholesalers and retailers.
A detailed accounting reveals that the value chain of manufactured goods represents a much larger share of the economy than the 11% generated at factories. Using calculations from U.S. input–output tables, performed for the MAPI Foundation by Inforum at the University of Maryland, we find that sales of manufactured goods and their associated services represent about one-third of total final demand in the economy. The value chain responsible for satisfying this demand stretches across the economy and the world.
A New Model for Manufacturing’s Multiplier Effect
The multiplier effect of spending for manufactured products on nonmanufacturing industries is also much higher than as conventionally measured in the input–output tables. The traditional output multiplier for manufacturing indicates that every dollar in final sales of manufactured products supports an additional $1.40 in upstream supply chain output from nonmanufacturing sectors in the economy.
Unfortunately, this basic multiplier includes final sales of imports and does not count the downstream sales chain. We modify the calculation to make it more meaningful. Removing final sales of imports from the denominator and adding downstream sales chain transactions increases the multiplier effect. With this adjustment, one dollar of domestic manufacturing downstream sales for final demand (the producers’ value at the factory loading dock) drives another $2.70 of supply transactions elsewhere in the economy, downstream and upstream.
This still paints an incomplete picture, however. These multipliers measure the volume of transactions between members in the supply and sales chains and therefore double count. As manufactured material passes to other members in the value chain, each transaction includes the previous step’s transactions.
In this report, the MAPI Foundation introduces a new multiplier that eliminates double counting and provides a more comprehensive treatment of manufacturing. According to our domestic manufacturing value chain multiplier, one dollar of domestic manufacturing value-added destined for manufactured goods final demand generates another $3.60 of value-added elsewhere.
Measuring the Manufacturing Value Chain
Manufacturing plant activities lie near the center of a substantial and complex value chain that is composed of an upstream supply chain that gathers materials and services and a downstream sales chain that moves goods to market and sells and services manufactured goods. Activities such as research and development, corporate management, logistics operations, and advertising and branding lie outside manufacturing industries’ definition as measured in national statistics. The conventional measurement of the manufacturing economic footprint, therefore, is badly underestimated.
The MAPI Foundation measures the manufacturing value chain in the most inclusive terms but still within the framework of national statistics. The method we use provides a better measure of the size of the manufacturing value chain and improves the understanding of the reach and importance of manufacturing operations and the goods produced. We answer the question of why the amount spent to purchase manufactured goods is so much higher than the manufacturing plant activity alone.
The MAPI Foundation finds that manufactured goods’ value is not limited to the factory floor. Other contributors include corporate R&D centers that advance product and manufacturing technology, the utility industry that produces the factory’s electricity, the transportation industry that delivers output to market, the wholesale and retail industry that performs sales and service activities, and providers of financial services and insurance. Our analysis details each industry’s contributions in terms of value-added and employment.
Following the Income (Supply)
Our approach tracks the supply of manufactured products by following the income, which broadens the scope to include both the supply chain and sales chain via tracing revenue. What we find from income analysis is that manufactured products directly or indirectly transact with every other sector in the economy, including agriculture, mining, professional services, and finance. A supply-side analysis also reveals more detail such as industry production, import penetration, industrial income, and employment.
In supply-side accounting, the total producers’ value for each sector includes the value of all of the intermediate inputs purchased for use in production plus the value-added generated by the production activity of firms. It is important to understand that value-added is the work an industry does itself, not work it pays others to perform. Value-added1 is calculated by deducting from producers’ value the “sourcing spend” (intermediate purchases for supplies, utilities, and services).
The primary focus of supply-side national accounting is ultimately to separate out value-added because when summed across all industries, value-added is equal to GDP. The income created from production must equal the final demand spending to purchase that production. A detailed input–output accounting of manufacturing supply allows all final demand to be traced to a value chain in terms of value-added by the domestic industry and imports (foreign value-added).
Manufacturing Is Defined Narrowly in National Statistics
Most economic industry statistics are constructed from data collected at the establishment level, not the firm level. There is a big difference between the two. In manufacturing, an establishment is a plant and a manufacturing firm may have many plants. A firm could also have a corporate office that is separate from a plant; this office is classified as management of a business enterprise (a service industry) in economic statistics. When location separates establishments, each establishment is classified into the industry that predominates at that location. For example, when an R&D center is located apart from a manufacturing plant, the activity at that center is counted as a service, not manufacturing. The same holds for a warehouse for wholesale trade and centralized logistics for transportation. In economic statistics, manufacturing consists only of manufacturing establishments (plants), irrespective of the other industries owned by the firm.
This narrow definition of manufacturing helps explain why the sector’s footprint is understated and why a comprehensive accounting of the supply of manufactured goods is needed. Tables 1 through 3 show the upstream supply chain, downstream sales chain, and the total value chain for manufactured products for final demand. Each table shows gross output (revenue), value-added, full-time equivalent (FTE) employment, total compensation, and annual compensation per full-time equivalent worker across various industries contributing value to manufactured goods bound for final demand.
Intermediates From the Upstream Supply Chain
All businesses buy intermediate goods and services that they incorporate into their products and services. Table 1 tracks the upstream supply chain by industry for revenue, value-added, employment, and compensation. Production from the upstream supply chain delivers the raw materials, processed inputs, and services required by the downstream sales chain. An upstream supply chain concept is illustrated in Figure 1, which shows a simplified motor vehicle example. To make motor vehicles, a factory needs steel (some of which is imported) and a domestic steel manufacturer purchases inputs such as coal; all of these materials require transportation from place to place and the transport vehicles consume fuel. A motor vehicle dealer also purchases utilities, insurance, and services to sell cars.
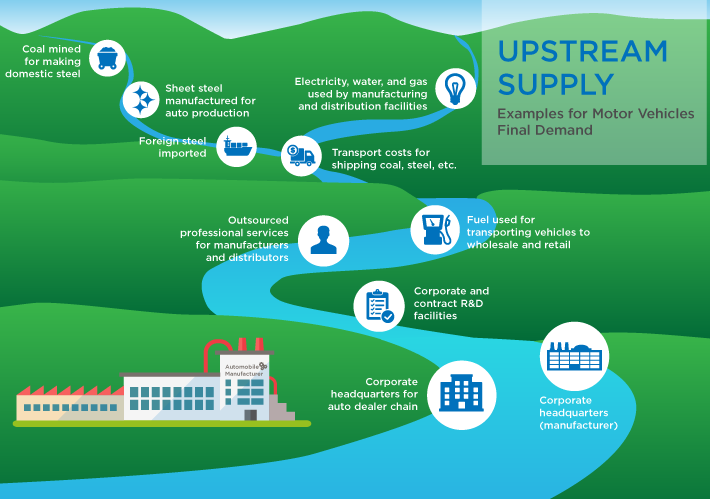
Figure 1
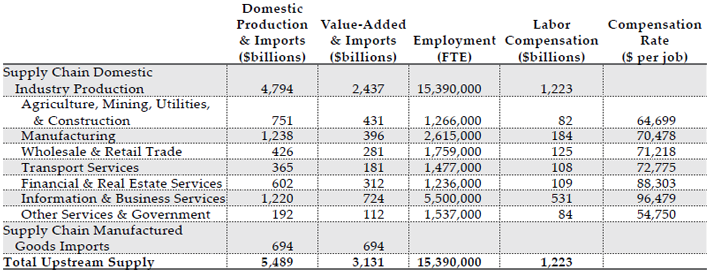
Table 1 – Upstream Supply Chain of Manufactured Goods Final Demand in 2014. Source(s): MAPI Foundation and Inforum
Many activities performed by firms are not classified in the industry of their primary activities. For example, most manufacturing corporate headquarters are considered part of the “management of companies and enterprises” (NAICS 55), a service industry. R&D centers and warehouses that are separate from factories are classified as professional services and wholesale trade, respectively.
We find that the upstream supply chain’s gross output is $5,489 billion (Table 1) in 2014. Total intermediate revenue includes $1,238 billion of intermediate manufacturing revenue (such as steel to automakers), but also $1,220 billion in information and business services (R&D centers, corporate headquarters, IT centers, etc.). Moreover, $694 billion of the indirect production is imported intermediate manufactured goods that are received by various industries: agriculture, mining, utilities, and construction; manufacturing; wholesale and retail trade; transport services; financial and real estate; information and business services; and other services and government industries. These imports are incorporated into a good or service supplied to a manufacturer.
The value-added from upstream supply chain production generated by manufactured goods demand totals $2,437 billion and this is spread across all industries of the economy. Supply chain imports of $694 billion are foreign value-added that are part of the total upstream supply chain. Combining domestic value-added and intermediate imports equals $3,131 billion of total value-added that is upstream manufacturing supply. Domestic upstream supply chain production creates 15,390,000 FTE jobs, including 2,615,000 FTEs in intermediate manufacturing and 5,500,000 FTEs in information and business services. The information and business services industry includes many highly compensated jobs at corporate headquarters, research centers, and business consulting firms.
The Downstream Sales Chain
The sale to the final user (purchasers’ value) of goods is higher than manufacturing revenue at the factory loading dock (producers’ value) because it includes transport, wholesale, and retail trade margins.2 Figure 2 illustrates the downstream sales chain by extending the simplified automotive value stream example. Manufacturing plants do not sell directly to the final users of the goods produced; they have distribution channels that move and market the products. Vehicles move from the factory and seaport loading docks to wholesale lots and then are transported to auto dealerships. There are several other services directly related to the purchase and operation of manufactured goods, e.g., rental and leasing services, insurance, professional services, maintenance, and repair. All of these associated downstream services are part of the manufactured goods sales chain.
Table 2 shows the value-added from the downstream sales chain for final manufactured goods generated in supplying the demand, including the value-added abroad or imports. Revenue from the final sale of domestic manufactured goods at the factory dock is $3,259 billion annually, sell-side margins and associated services employed to make the final sale are $2,436 billion, and the value of finished manufactured goods imports at the seaport dock are $1,024 billion. Therefore, the total sales chain supply is $6,719 billion.
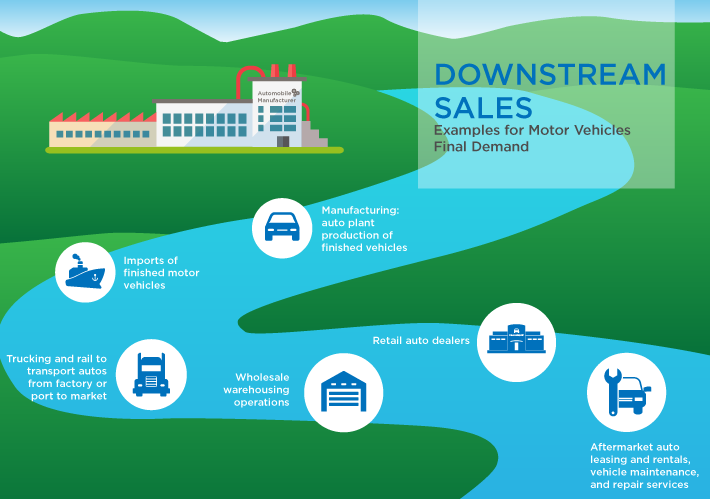
Figure 2
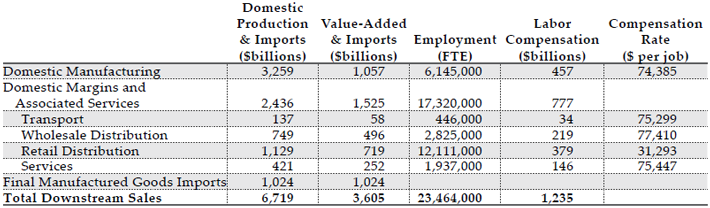
Table 2 – Downstream Sales Chain of Manufactured Goods Final Demand in 2014. Source(s): MAPI Foundation and Inforum
Sales chain domestic manufacturers that sell final goods going to the ultimate user price the item to include all of their intermediate purchases (sourcing spend) plus the value that they added. As shown in Table 2, the sales chain value-added for manufactured goods for final demand is $1,057 billion for domestic manufacturing, $1,525 billion for margins and associated services, and $1,024 billion for imports (the cost at the seaside dock is all foreign value-added). The manufacturing goods sales chain creates 23,464,000 FTE jobs—6,145,000 jobs in manufacturing and 17,320,000 jobs in margins and associated services industries.
These data demonstrate how efficient manufacturing is at delivering $1 million in value-added relative to other industries supplying final products. It takes about 5.8 FTE manufacturing jobs to deliver $1 million in value-added. One-third more FTE workers (7.7) are required to deliver $1 million in value-added from transportation and services industries. The industry with the lowest productivity is retail trade, requiring nearly three times as many FTEs (16.9) as manufacturing to deliver this value-added. The employment from the manufacturing goods sales chain generates total labor compensation of $1,235 billion annually.
The Total Value Stream
Table 3 summarizes how manufactured goods for final demand show up on the supply side of the economy. The sum of total upstream supply purchases ($5,489 billion in Table 1) and total downstream sales revenue ($6,719 billion in Table 2) equals total gross duplicated output ($12,208 billion in Table 3). The reason there is duplication, or double counting, is that the final sales prices in the downstream sales revenue already include the procurement spend for intermediates. The sum of value-added for manufactured goods for final demand ($6,737 billion—upstream supply and downstream sales) plus imports contains none of the double counting of gross output.
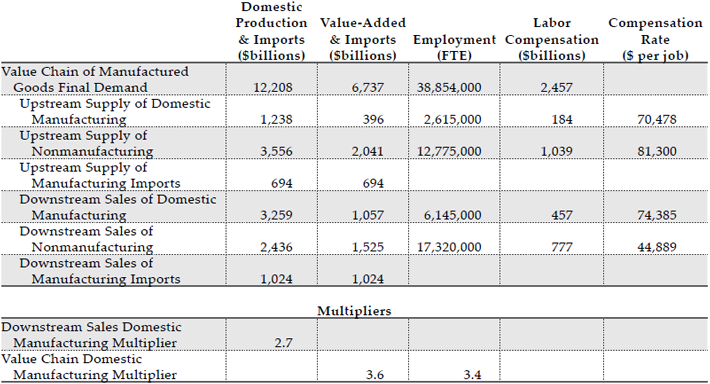
Table 3 – Total Value Chain of Manufactured Goods Final Demand in 2014. Source(s): MAPI Foundation and Inforum
We arrange the value chain of manufactured goods for final demand into broad upstream supply and downstream sales categories. The upstream supply chain makes up 46% of the value-added of manufactured goods for final demand and the downstream sales chain accounts for the remaining 54%. Dissecting value-added into manufacturing, nonmanufacturing, and imports, we find that the nonmanufacturing value-added share is 53% and imports’ share (i.e., imported value-added) is another 25%. Domestic manufacturing accounts for only 22% of the value chain of manufactured goods final demand.
Manufacturing imports enter the value stream at different stages. Finished products, which amount to $1,024 billion annually (60% of manufacturing imports), directly enter the downstream sales chain. For example, a motor vehicle produced in Japan is transported from the seaport dock to wholesale and then to the retail auto dealer, bypassing U.S. manufacturing plants. The other $694 billion of manufacturing imports enter the manufactured goods value stream in the upstream supply chain of domestic manufacturing. An example is a foreign-produced auto part sourced by the procurement department of an auto manufacturer for its U.S. plant.
The total value chain of manufactured goods for final demand supports 38,854,000 FTEs and $2,457 billion in compensation. The downstream sales chain employs 23,465,000 FTEs and the upstream supply chain has 15,390,000 FTEs. Another way to parse the employment is to separate jobs into manufacturing and nonmanufacturing. We find that nonmanufacturing FTE employment totals 30,095,000. There are only 8,760,000 FTE domestic manufacturing jobs in the value chain of manufactured goods final demand.
Manufacturing Multipliers
“Multipliers” that show how activity in manufacturing relates to activity in nonmanufacturing industries are presented in Table 3. The downstream sales of domestic manufacturing multiplier is 2.7,3 meaning that for every dollar of domestic manufacturing downstream sales for final demand (the producers’ value at the factory loading dock), another $2.70 of production is required elsewhere (downstream and upstream, including upstream supply manufacturing production).4
Using the motor vehicle example, the producer’s price of a vehicle at the factory loading dock embodies all the value-added to produce the vehicle. The value of all transactions required to get the goods and services to the final manufacturer and leaving the factory loading dock to the final consumer is 2.7 times the producer’s price.
It is true that gross output measures all transactions, including those for final sale and intermediate supply, and this results in double counting. Nevertheless, the value chain analysis in this study expands the traditional supply-side manufacturing multiplier to include the sales-side activities associated with getting the product into the hands of the final purchasers.
There is a multiplier that eliminates the double counting problem and narrows the measure to domestic manufacturing rather than manufactured goods (which include imports)—the domestic manufacturing multiplier for value-added. The domestic value-added multiplier includes manufacturing value-added upstream as intermediate goods and downstream in final manufactured goods. We find that for every dollar of domestic manufacturing value-added destined for manufactured goods final demand, another $3.60 of value-added is generated elsewhere. Expressing the multiplier in terms of jobs, for each full-time equivalent job in manufacturing dedicated to producing value for final demand, there are 3.4 FTE jobs created in nonmanufacturing.
Wait—There Is Still More Manufacturing Value to Capture
Up to this point, we have focused on manufacturing production for manufacturing products sold to final demand (households, business investment, government, and exports). In Table 4, we recognize manufacturing production for other industries’ supply chains (e.g., construction supplies for the construction supply chain).
There is a large portion of total manufacturing production, value-added, and employment that is not included in the production of a manufactured good that is sold to final demand, since manufacturers produce goods that are intermediates in nonmanufacturing final demand value chains. For instance:
- Manufactured materials such as structural steel and nonmetallic mineral products (gypsum, cement, concrete products, glass, etc.) are upstream production in the construction industry value chain.
- Manufactured fuel and spare parts purchased as inputs for final demand for passenger airlines or mass transit are not in the manufactured goods for final demand supply chain.
- Chemical fertilizer is an intermediate input in the agriculture industry upstream supply chain.
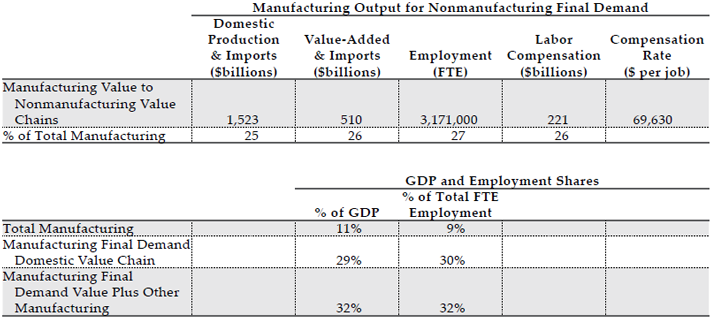
Table 4 – More Manufacturing Value in 2014. Source(s): MAPI Foundation and Inforum
Manufacturing for nonmanufacturing supply chains provides additional vital roles for manufacturing activity in the economy. The measurement of manufacturing for nonmanufacturing supply chains is a simple subtraction. We know total domestic manufacturing output, value-added, and FTE employment from national statistics. Subtracting the downstream domestic manufacturing and upstream manufacturing for the manufactured goods for final demand chain from the total reveals manufacturing activity for nonmanufacturing supply chains.
The MAPI Foundation finds that 25% of total manufacturing production ($1,523 billion), 26% of total manufacturing value-added ($510 billion), 27% of total manufacturing FTE employment (3,171,000), and 26% of total manufacturing compensation ($221 billion) is manufacturing activity for upstream supply in a nonmanufacturing final demand supply chain.
The manufacturing final demand domestic value chain plus the domestic manufacturing value-added for nonmanufacturing final demand equals domestic manufacturing’s impact on the U.S. economy. The domestic manufactured goods value chain accounts for 29% of GDP and the manufacturing value-added committed to nonmanufacturing value chains adds another 3% of GDP.
The sum reveals an important bottom line of this report. The MAPI Foundation finds that manufactured goods drive an extended supply and sales chain of value-added involving nearly all industries in the economy that totals 32% of GDP. We find that the narrow definition that manufacturing value-added is 11% of GDP is only the tip of the iceberg. Manufacturing receives inputs from a nonmanufacturing upstream supply chain and a downstream sales chain that brings the factory goods to market and then provides aftermarket services. The MAPI Foundation finds that the manufactured goods value chain plus manufacturing for other industries’ supply chains accounts for about one-third of GDP in the United States.
Just as important are the jobs created by manufacturing activity. In the narrow definition of manufacturing employment, the industry accounts for just 9% of economy-wide FTE employment. The MAPI Foundation’s analysis finds the manufactured goods for final demand value chain claims 30% of FTE employment. When adding the 2% of total FTE jobs in manufacturing that support nonmanufacturing value chains, the manufacturing-driven share of total U.S. employment rises to 32%. About one-third of U.S. FTE jobs are linked to manufacturing.
Manufacturing activities lie near the center of a substantial and complex value chain that is composed of an upstream supply chain that gathers materials and services and a downstream sales chain that moves goods to market and sells and services manufactured goods. Domestic manufacturing also provides goods as inputs to nonmanufacturing supply chains. The central finding is that the conventional measurement of manufacturing’s share of the GDP is grossly underestimated. The manufacturing footprint is about a third of the economy, not a tenth.
Appendix
Following the Spending (Final Demand)
Manufactured goods drive much more economic value than what is measured at the factory loading dock. Spending by the end user, or “final demand,” is the price paid by the final customer of the good at a retail store, equipment wholesaler, or export dock, or by the government. Final demand expenditure analysis begins with a finished good sitting at the factory or seaport loading dock and then tracks value downstream to the final sale. Total final demand is the sum of all final demand expenditures for domestic and imported goods by households, businesses, the government, and foreign buyers.
An expenditure approach allows us to trace manufactured goods through the sales chain and expose substantially more value in purchased goods than just accounting for the supply chain. The main finding from this comprehensive assessment of the impact of manufactured goods on value creation is that expenditures for manufactured goods are 34% of final demand, much higher than the 11% of GDP reported in the narrow measure of manufacturing industry value-added.
The amount of the sales chain markup varies considerably by the type of final demand, but overall is quite large. Table 5 shows the final expenditures on manufactured goods for each purchaser. The main point is that manufacturers’ revenue at the factory loading dock is at the end of the upstream supply chain and the beginning of the downstream sales chain that leads to a final demand expenditure. There is a symbiotic relationship between the upstream supply chain and downstream sales chain, with the factory right in the middle of the value stream.
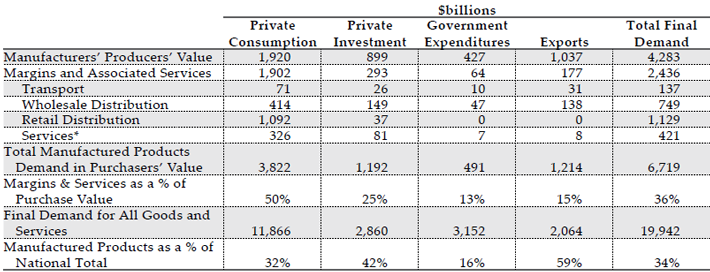
Table 5 – Manufactured Goods in Final Demand in 2014 (*Rental, leasing, insurance, professional services, maintenance, and repair). Source(s): MAPI Foundation and Inforum.
Final demand is the sum of spending by the four main agents in the economy—households, businesses, government, and foreign buyers. Private household consumption is the largest source of final demand; based on 2014 data, consumers spend $3,822 billion annually for manufactured goods. The value of manufactured goods at the factory loading dock bound for final demand is only $1,920 billion, however. The remaining $1,902 billion is accounted for by margins for transport, wholesale distribution, retail distribution, and associated services (rental, leasing, insurance, professional services, maintenance, and repair). On average, products sold to consumers for $100 cost only $50 at the factory loading dock. Manufacturing is the feedstock that enables the downstream sales chain to double the purchasers’ value collected from households. Total consumer spending for goods and services is $11,866 billion, with 32% of that demand ($3,822 billion) going toward manufactured goods.
The business investment downstream sales chain generally has fewer steps. Private investment final demand includes nonresidential construction, equipment, research and development expenditures, housing construction, and inventory accumulation. Most of the manufactured goods bound for private investment are various types of production and transportation equipment. The vast majority of business equipment is not sold through retail trade and thus does not incur retail sales margins. Further, investment products need fewer associated services per dollar of producer value than consumer goods do. Business investment final demand for manufactured goods is $1,192 billion annually; the producers’ value at the factory gate is $899 billion and margins and associated services add 25% ($293 billion) to the purchasers’ cost. Total business investment expenditures for all equipment, structures, and services are $2,860 billion. Forty-two percent of this private investment spending is for manufactured goods.
The margins and associated services to bring manufactured products to market are much lower for final sales to government and exports. The markup from the factory loading dock to final sale is only 13% for government purchases and 15% for exports. Manufactured products make up a relatively small portion of government sector purchases, at $491 billion—only 16% of the $3,152 billion in total government expenditures. For exports, however, the $1,214 billion of manufactured goods is 59% of the value of all exports ($2,064 billion).
A central finding of this study is that the manufacturing value chain is much larger than is suggested by the simple ratio of value-added to GDP. In aggregate, manufactured goods bound for final demand sell for $4,283 billion at the factory loading dock, with a markup of 36% ($2,436 billion). Manufactured goods clearly have a substantial role in the economy. Manufactured goods spending by all four categories—households, businesses, government, and exports—is $6,719 billion5 annually, a whopping 34% of total final demand.
1. In terms of specific accounts, value-added is the sum of labor compensation, capital income (profits, rent, interest, and depreciation), and net indirect taxes paid (production and imports taxes minus subsidies).
2. The value of the trade services provided in delivering commodities from producers’ establishments to purchasers, where the purchaser pays for the services.
3. The downstream sales domestic manufacturing multiplier is calculated by dividing the value chain of manufactured goods for final demand excluding downstream sales of domestic manufacturing by the downstream sales of domestic manufacturing ((12,208-3,259)/3,259 billion).
4.This multiplier is closest to the oft-quoted multiplier of 1.4 (in 2014). This multiplier is derived from the BEA total requirements table, but as such, it includes only upstream indirect output and does not correct for imports. Adding downstream supply and its associated indirect output adds 1.3 to the multiplier, even when imports are taken out.
5. Except for a small amount of statistical discrepancy, the $6,737 billion manufacturing value chain value-added is essentially the same as the $6,719 billion manufactured goods for final demand in Table 1 and total sales output in Table 2. Demand equals supply.


Comments