AFT Impulse 7 has several different tools to analyze waterhammer, including several new features such as Visual Report Animation. This tool offers a new method to understand how different sections in a network interact with each other allowing users to quickly locate points of interest for further analysis, and visually demonstrate the system behavior to others. To make better use of this qualitative tool, here are a few tips for setting up your animation.
Save all pipe stations
By default, AFT Impulse will save the data only from the inlet and the outlet stations of the pipes in order to save time on the transient run. The Visual Report Animation feature can still animate the model if this is the only available information, but its color gradient will only be based on the endpoints. This will provide a general idea of how the pressure is changing from pipe to pipe, but the animation will not be as smooth or as accurate; if less information is available, less can be animated.
https://www.aft.com/images/easyblog_articles/518/Visual-Report-Animation-short.mp4?cache_bust=true
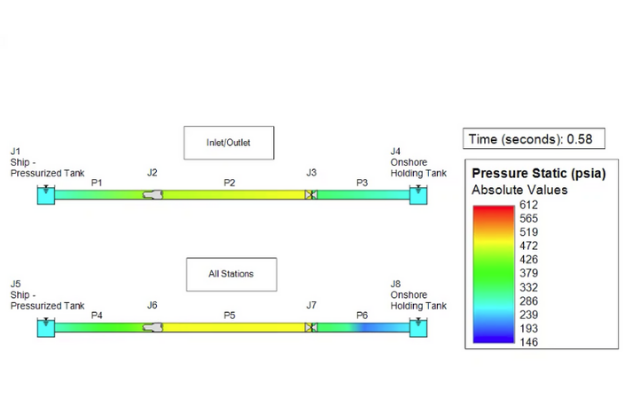
To get a better grasp of the behavior, all pipe station data can be saved, which allows the Visual Report Animation to animate every individual computational station. The animation below gives an example of this for a transfer line from a pressurized holding tank on a ship to an onshore holding tank. The valve closes over 0.5 seconds, causing the resultant pressure waves.
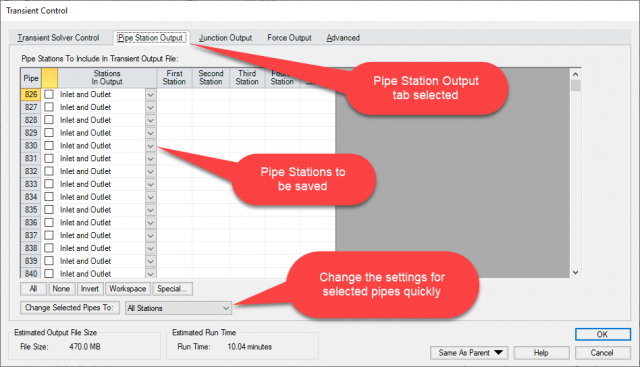
Figure 2: Pipe Stations Output tab highlighting the stations to be saved for the model, and how to change them.
The pipe section settings can be updated in transient control by changing the selection for “Stations in Output” as shown below.
It should be noted that you can choose to save extra data for a few pipes of interest while leaving other pipes with the default settings in order to decrease run time while still saving extra data in important sections.
Animate small sections at a time
For large models, it may help to isolate a small section of interest in the model. There are a few advantages to doing this. One benefit is that this makes it easy to save all output, making the animation of higher quality. The other advantage is that this can help to create more distinctions in the color scale, as the auto-scale will be adjusted based on the pipes being animated. Being able to use a smaller scale provides more clarity in how the different sections of the model interact.
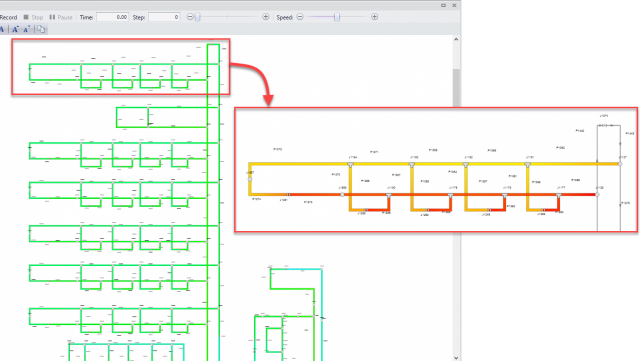
Figure 3: Animating smaller sections of the model can allow for more clarity in color changes.
Similar to graph animation, the animation can also be manually stepped forward and backwards, which can be a useful tool when looking at a small enough region.
Adjust the animation settings
If the animation is not showing visible changes due to odd scaling from pressure spikes or other extreme conditions, the visual report animation feature has several options to account for this circumstance. A quick method to handle this is to set a custom scale for the colors by un-checking the auto scale button in order to tighten the scale. AFT Impulse automatically determines the scale by using the minimum and maximum values for the pipes being animated.
The other tool that may come in handy is changing the Data Type being used for animation. By default the absolute values are used for animation, but for cases such as high pressure systems, showing the actual output for pressure may produce a poor scale due to the large magnitude of changes. In this case it may be best to use the relative changes from the steady state in order to better explore how the system is changing.
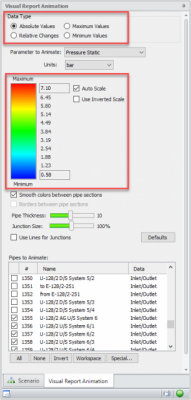
Figure 4: The Visual Report Animation tab in the Quick Access panel allows you to see the impact of changes directly on the model to best tune the animation.
Visual Report animations are more than just a flashy feature – they can help to quickly visualize the impacts of events on the network for better communication and clarity.
Comments